# Technical Document Extraction: Adjacency Matrix Analysis
## 1. Image Overview
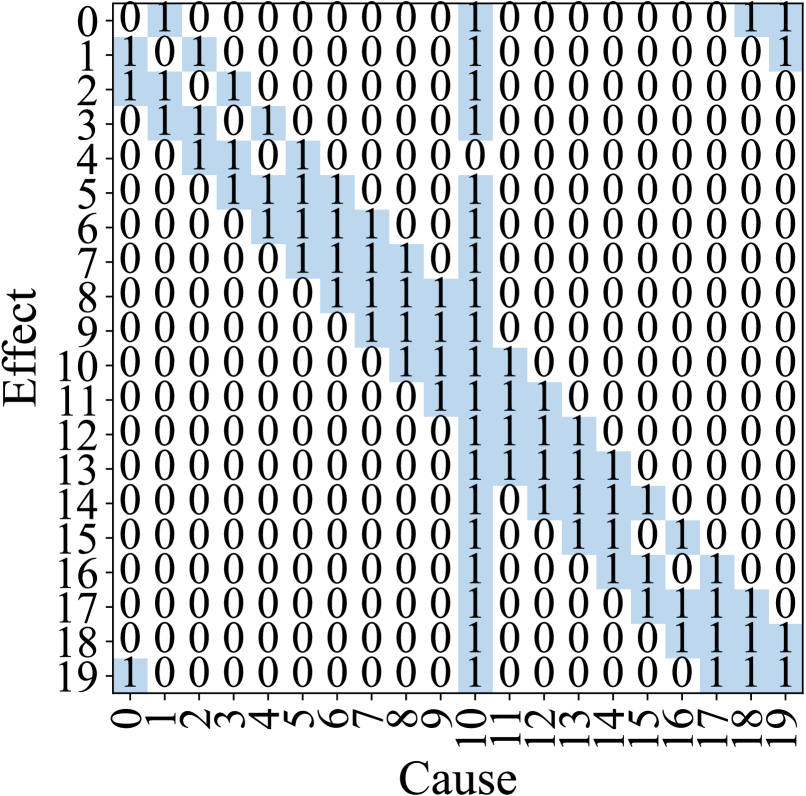
The image displays a 20x20 binary matrix (or heatmap) representing a causal relationship between variables. The matrix uses numerical values (0 and 1) and light blue shading to indicate the presence of an "Effect" based on a "Cause."
## 2. Component Isolation
### Header/Labels
- **Y-Axis Label:** "Effect" (oriented vertically on the left).
- **X-Axis Label:** "Cause" (oriented horizontally at the bottom).
- **Y-Axis Markers:** Integers from **0 to 19** (top to bottom).
- **X-Axis Markers:** Integers from **0 to 19** (left to right, rotated 90 degrees).
### Main Chart Area
The chart is a grid where each cell contains either a `0` (white background) or a `1` (light blue background). The blue shading strictly corresponds to the presence of a `1`.
## 3. Data Table Reconstruction
The following table represents the matrix data. Rows represent the **Effect** index, and columns represent the **Cause** index.
| Effect \ Cause | 0 | 1 | 2 | 3 | 4 | 5 | 6 | 7 | 8 | 9 | 10 | 11 | 12 | 13 | 14 | 15 | 16 | 17 | 18 | 19 |
| :--- | :---: | :---: | :---: | :---: | :---: | :---: | :---: | :---: | :---: | :---: | :---: | :---: | :---: | :---: | :---: | :---: | :---: | :---: | :---: | :---: |
| **0** | 0 | 1 | 0 | 0 | 0 | 0 | 0 | 0 | 0 | 0 | 1 | 0 | 0 | 0 | 0 | 0 | 0 | 0 | 1 | 1 |
| **1** | 1 | 0 | 1 | 0 | 0 | 0 | 0 | 0 | 0 | 0 | 1 | 0 | 0 | 0 | 0 | 0 | 0 | 0 | 0 | 1 |
| **2** | 1 | 1 | 0 | 1 | 0 | 0 | 0 | 0 | 0 | 0 | 1 | 0 | 0 | 0 | 0 | 0 | 0 | 0 | 0 | 0 |
| **3** | 0 | 1 | 1 | 0 | 1 | 0 | 0 | 0 | 0 | 0 | 1 | 0 | 0 | 0 | 0 | 0 | 0 | 0 | 0 | 0 |
| **4** | 0 | 0 | 1 | 1 | 0 | 1 | 0 | 0 | 0 | 0 | 0 | 0 | 0 | 0 | 0 | 0 | 0 | 0 | 0 | 0 |
| **5** | 0 | 0 | 0 | 1 | 1 | 1 | 1 | 0 | 0 | 0 | 1 | 0 | 0 | 0 | 0 | 0 | 0 | 0 | 0 | 0 |
| **6** | 0 | 0 | 0 | 0 | 1 | 1 | 1 | 1 | 0 | 0 | 1 | 0 | 0 | 0 | 0 | 0 | 0 | 0 | 0 | 0 |
| **7** | 0 | 0 | 0 | 0 | 0 | 1 | 1 | 1 | 1 | 0 | 1 | 0 | 0 | 0 | 0 | 0 | 0 | 0 | 0 | 0 |
| **8** | 0 | 0 | 0 | 0 | 0 | 0 | 1 | 1 | 1 | 1 | 1 | 0 | 0 | 0 | 0 | 0 | 0 | 0 | 0 | 0 |
| **9** | 0 | 0 | 0 | 0 | 0 | 0 | 0 | 1 | 1 | 1 | 1 | 0 | 0 | 0 | 0 | 0 | 0 | 0 | 0 | 0 |
| **10** | 0 | 0 | 0 | 0 | 0 | 0 | 0 | 0 | 1 | 1 | 1 | 1 | 0 | 0 | 0 | 0 | 0 | 0 | 0 | 0 |
| **11** | 0 | 0 | 0 | 0 | 0 | 0 | 0 | 0 | 0 | 1 | 1 | 1 | 1 | 0 | 0 | 0 | 0 | 0 | 0 | 0 |
| **12** | 0 | 0 | 0 | 0 | 0 | 0 | 0 | 0 | 0 | 0 | 1 | 1 | 1 | 1 | 0 | 0 | 0 | 0 | 0 | 0 |
| **13** | 0 | 0 | 0 | 0 | 0 | 0 | 0 | 0 | 0 | 0 | 1 | 1 | 1 | 1 | 1 | 0 | 0 | 0 | 0 | 0 |
| **14** | 0 | 0 | 0 | 0 | 0 | 0 | 0 | 0 | 0 | 0 | 1 | 0 | 1 | 1 | 1 | 1 | 0 | 0 | 0 | 0 |
| **15** | 0 | 0 | 0 | 0 | 0 | 0 | 0 | 0 | 0 | 0 | 1 | 0 | 0 | 1 | 1 | 0 | 1 | 0 | 0 | 0 |
| **16** | 0 | 0 | 0 | 0 | 0 | 0 | 0 | 0 | 0 | 0 | 1 | 0 | 0 | 0 | 1 | 1 | 0 | 1 | 0 | 0 |
| **17** | 0 | 0 | 0 | 0 | 0 | 0 | 0 | 0 | 0 | 0 | 1 | 0 | 0 | 0 | 0 | 1 | 1 | 1 | 1 | 0 |
| **18** | 0 | 0 | 0 | 0 | 0 | 0 | 0 | 0 | 0 | 0 | 1 | 0 | 0 | 0 | 0 | 0 | 1 | 1 | 1 | 1 |
| **19** | 1 | 0 | 0 | 0 | 0 | 0 | 0 | 0 | 0 | 0 | 1 | 0 | 0 | 0 | 0 | 0 | 0 | 1 | 1 | 1 |
## 4. Key Trends and Structural Observations
### Banded Structure (Local Connectivity)
The matrix exhibits a strong **diagonal banding pattern**. Most `1` values are clustered around the main diagonal, suggesting that each variable (index $i$) is primarily caused by its immediate neighbors (indices $i-1, i, i+1$).
* **Trend Verification:** The "1" values form a thick line sloping downward from the top-left to the bottom-right.
### Global Hub (Column 10)
A significant vertical feature is present at **Cause 10**.
* **Observation:** Column 10 is almost entirely populated with `1`s (except for Effect 4).
* **Interpretation:** Variable 10 acts as a "Universal Cause" or a central hub that influences nearly every other variable in the system.
### Boundary Conditions (Wrap-around)
There are `1` values in the extreme corners:
* **Top-Right:** Effect 0 is caused by 18 and 19; Effect 1 is caused by 19.
* **Bottom-Left:** Effect 19 is caused by 0.
* **Interpretation:** This suggests a periodic or circular boundary condition where the end of the sequence (19) connects back to the beginning (0).
### Symmetry
The matrix is largely symmetric, but not perfectly so. For example, at (Effect 0, Cause 1) there is a `1`, and at (Effect 1, Cause 0) there is a `1`. However, the "Hub" at Cause 10 is not mirrored by a "Hub" at Effect 10, indicating a directed relationship rather than a simple correlation.