## Line Graphs: Classification Accuracy (Acc_test) vs. Parameters (c/t)
### Overview
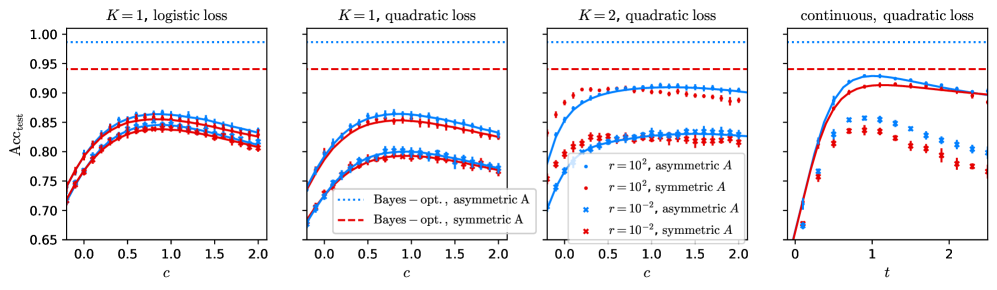
The image contains four line graphs comparing classification accuracy (Acc_test) across different parameter configurations. Each graph varies in:
- **K** (number of classes: K=1 or K=2)
- **Loss function** (logistic or quadratic)
- **Matrix symmetry** (symmetric vs. asymmetric)
- **Parameter** (c or t on x-axis)
- **Regularization strength** (r=10² or r=10⁻²)
### Components/Axes
1. **Y-axis**: Acc_test (classification accuracy) scaled from 0.65 to 1.00.
2. **X-axes**:
- First three graphs: Parameter **c** (0.0 to 2.0).
- Fourth graph: Parameter **t** (0.0 to 2.0).
3. **Legends**:
- **Bayes-opt., asymmetric A**: Blue dotted line.
- **Bayes-opt., symmetric A**: Red dashed line.
- **r=10², asymmetric A**: Blue crosses.
- **r=10², symmetric A**: Red crosses.
4. **Line styles/colors**:
- Dotted (Bayes-opt. asymmetric), dashed (Bayes-opt. symmetric), crosses (r=10²).
### Detailed Analysis
#### Graph 1: K=1, Logistic Loss
- **Trends**:
- Bayes-opt. asymmetric (blue dotted) and symmetric (red dashed) lines start near 0.75, peak at ~0.85 (c≈1.0), then plateau.
- r=10² asymmetric (blue crosses) and symmetric (red crosses) lines start lower (~0.7), rise to ~0.8 (c≈1.5), then plateau.
- **Key data points**:
- At c=0.0: All lines ~0.7.
- At c=1.0: Bayes-opt. lines ~0.85; r=10² lines ~0.8.
- At c=2.0: All lines plateau near 0.8–0.85.
#### Graph 2: K=1, Quadratic Loss
- **Trends**:
- Bayes-opt. lines (blue dotted/red dashed) show similar behavior to Graph 1 but with slightly lower peaks (~0.83 at c=1.0).
- r=10² lines (blue crosses/red crosses) start lower (~0.72) and plateau earlier (~0.8 at c=1.0).
- **Key data points**:
- At c=0.0: All lines ~0.7.
- At c=1.0: Bayes-opt. lines ~0.83; r=10² lines ~0.8.
- At c=2.0: All lines plateau near 0.8–0.83.
#### Graph 3: K=2, Quadratic Loss
- **Trends**:
- Bayes-opt. lines (blue dotted/red dashed) start lower (~0.75) and rise to ~0.88 (c≈1.0), then plateau.
- r=10² lines (blue crosses/red crosses) start lower (~0.7) and plateau earlier (~0.82 at c=1.0).
- **Key data points**:
- At c=0.0: All lines ~0.7.
- At c=1.0: Bayes-opt. lines ~0.88; r=10² lines ~0.82.
- At c=2.0: All lines plateau near 0.85–0.88.
#### Graph 4: Continuous, Quadratic Loss
- **Trends**:
- Bayes-opt. lines (blue dotted/red dashed) rise sharply to ~0.95 (t≈1.0), then decline slightly.
- r=10² lines (blue crosses/red crosses) start lower (~0.75) and plateau at ~0.85 (t≈1.0).
- **Key data points**:
- At t=0.0: All lines ~0.7.
- At t=1.0: Bayes-opt. lines ~0.95; r=10² lines ~0.85.
- At t=2.0: Bayes-opt. lines ~0.9; r=10² lines ~0.8.
### Key Observations
1. **Bayes-opt. classifiers outperform r=10² classifiers** across all configurations, with accuracy gaps widening as K increases.
2. **Symmetric vs. asymmetric matrices**:
- Symmetric matrices (red dashed/crosses) generally perform slightly better than asymmetric (blue dotted/crosses) in K=1 and K=2 cases.
- In the continuous case (Graph 4), symmetric and asymmetric Bayes-opt. lines converge at higher t values.
3. **Parameter sensitivity**:
- For r=10², accuracy plateaus earlier (c/t≈1.0–1.5) compared to Bayes-opt. lines.
- The continuous case (Graph 4) shows a distinct decline in r=10² performance after t=1.0.
### Interpretation
- **Bayes-opt. superiority**: The consistent outperformance of Bayes-opt. classifiers suggests that optimal parameter tuning (asymmetric/symmetric) is critical for high accuracy, especially as problem complexity (K) increases.
- **Regularization trade-off**: r=10² introduces bias, leading to earlier plateaus and lower peak accuracy. This implies over-regularization may hinder model adaptability.
- **Loss function impact**: Quadratic loss (Graphs 2–4) generally yields higher accuracy than logistic loss (Graph 1), possibly due to smoother optimization landscapes.
- **Continuous parameter (t)**: The fourth graph’s decline in r=10² performance after t=1.0 highlights sensitivity to parameter scaling in dynamic settings.
This analysis underscores the importance of balancing regularization strength and classifier design to maximize accuracy in classification tasks.