# Technical Data Extraction: MoSe2 Current Density and Potential Maps
This document provides a detailed technical extraction of the data presented in the two-panel scientific visualization. The image consists of two heatmaps with overlaid vector streamlines, representing physical properties of a MoSe2 (Molybdenum diselenide) system.
## 1. General Metadata
* **Material:** MoSe2
* **Fermi Energy ($E_F$):** -100 (meV)
* **Angle ($\theta$):** 22.7°
* **Coordinate System:**
* **X-axis:** length (nm), ranging from -40 to 40.
* **Y-axis:** width (nm), ranging from -15 to 15 (labeled markers at -10, 0, 10).
---
## 2. Panel (c) Analysis
### Header Information
* **Label:** (c)
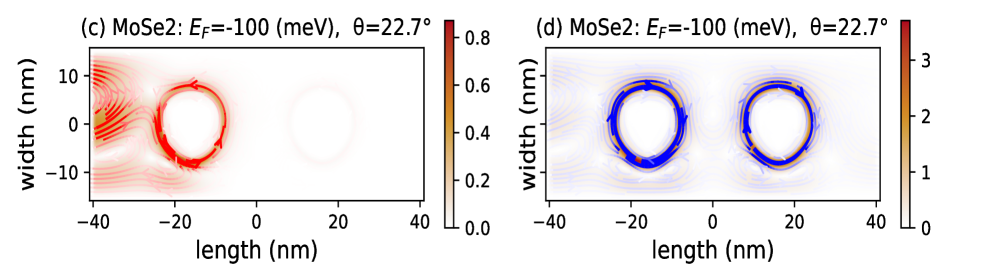
* **Title Text:** MoSe2: $E_F$=-100 (meV), $\theta$=22.7°
### Spatial Data and Trends
* **Component Isolation:** This panel displays a localized intensity field concentrated on the left side of the plot.
* **Visual Trend:** The highest intensity is located at the far left boundary (length $\approx$ -40 nm). A secondary circular feature (vortex-like) is centered at approximately length = -15 nm, width = 0 nm. The right half of the plot (length > 0 nm) shows near-zero intensity.
* **Streamlines:** Red streamlines indicate a clockwise flow around the circular feature centered at (-15, 0).
### Color Scale (Legend)
* **Location:** Right side of panel (c).
* **Type:** Sequential heatmap (White to Dark Red/Brown).
* **Range:** 0.0 to 0.8 (units not explicitly stated, likely normalized current density or local density of states).
* **Markers:** 0.0, 0.2, 0.4, 0.6, 0.8.
---
## 3. Panel (d) Analysis
### Header Information
* **Label:** (d)
* **Title Text:** MoSe2: $E_F$=-100 (meV), $\theta$=22.7°
### Spatial Data and Trends
* **Component Isolation:** This panel displays two distinct, high-intensity circular features.
* **Visual Trend:**
* **Feature 1:** A circular ring centered at approximately length = -15 nm, width = 0 nm.
* **Feature 2:** A circular ring centered at approximately length = +15 nm, width = 0 nm.
* The intensity is significantly higher than in panel (c), as indicated by the color scale.
* **Streamlines:** Blue streamlines with arrows indicate counter-clockwise flow around both circular features.
### Color Scale (Legend)
* **Location:** Right side of panel (d).
* **Type:** Sequential heatmap (White to Dark Red/Brown).
* **Range:** 0 to 3 (units not explicitly stated, likely a different physical quantity than panel c, such as magnetic field or potential).
* **Markers:** 0, 1, 2, 3.
---
## 4. Comparative Summary
| Feature | Panel (c) | Panel (d) |
| :--- | :--- | :--- |
| **Primary Focus** | Left-side boundary and one vortex | Two symmetric circular features |
| **Max Scale Value** | 0.8 | 3.0 |
| **Flow Direction** | Clockwise (Red arrows) | Counter-clockwise (Blue arrows) |
| **Vortex Centers (approx)** | (-15, 0) | (-15, 0) and (+15, 0) |
**Note on Language:** All text in the image is in English. No other languages were detected.