## Line Chart: Layer vs. ΔP for Mistral-7B Models
### Overview
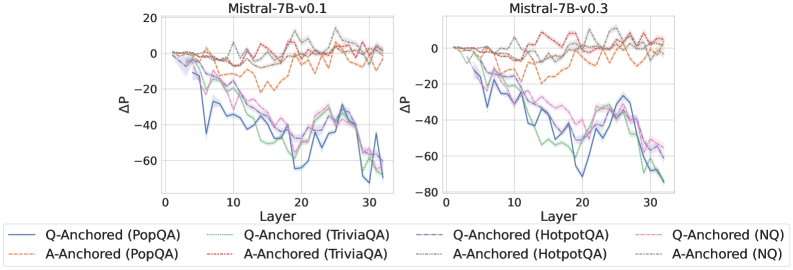
The image presents two line charts comparing the performance of Mistral-7B-v0.1 and Mistral-7B-v0.3 models across different layers. The charts plot the change in performance (ΔP) against the layer number for various question answering tasks, differentiated by anchoring method (Q-Anchored vs. A-Anchored) and dataset (PopQA, TriviaQA, HotpotQA, NQ).
### Components/Axes
* **Titles:**
* Left Chart: "Mistral-7B-v0.1"
* Right Chart: "Mistral-7B-v0.3"
* **X-axis:** "Layer"
* Scale: 0 to 30, incrementing by 10.
* **Y-axis:** "ΔP" (Change in Performance)
* Scale: -80 to 20, incrementing by 20.
* **Legend:** Located at the bottom of the image.
* Q-Anchored (PopQA): Solid Blue Line
* A-Anchored (PopQA): Dashed Brown Line
* Q-Anchored (TriviaQA): Dotted Green Line
* A-Anchored (TriviaQA): Dash-Dotted Pink Line
* Q-Anchored (HotpotQA): Dash-Dotted Dark-Gray Line
* A-Anchored (HotpotQA): Dotted Red Line
* Q-Anchored (NQ): Dash-Dotted Light-Purple Line
* A-Anchored (NQ): Dotted Dark-Gray Line
### Detailed Analysis
**Left Chart: Mistral-7B-v0.1**
* **Q-Anchored (PopQA):** (Solid Blue Line) Starts at approximately 0, decreases sharply to around -45 by layer 10, fluctuates between -30 and -60 until layer 30. Ends around -60.
* **A-Anchored (PopQA):** (Dashed Brown Line) Starts at approximately 0, remains relatively stable between -5 and 5 across all layers.
* **Q-Anchored (TriviaQA):** (Dotted Green Line) Starts at approximately 0, decreases to around -40 by layer 10, fluctuates between -30 and -50 until layer 30. Ends around -50.
* **A-Anchored (TriviaQA):** (Dash-Dotted Pink Line) Starts at approximately 0, decreases to around -30 by layer 10, fluctuates between -30 and -40 until layer 30. Ends around -40.
* **Q-Anchored (HotpotQA):** (Dash-Dotted Dark-Gray Line) Starts at approximately 0, remains relatively stable between -5 and 5 across all layers.
* **A-Anchored (HotpotQA):** (Dotted Red Line) Starts at approximately 0, remains relatively stable between -5 and 10 across all layers.
* **Q-Anchored (NQ):** (Dash-Dotted Light-Purple Line) Starts at approximately 0, decreases to around -30 by layer 10, fluctuates between -30 and -40 until layer 30. Ends around -40.
* **A-Anchored (NQ):** (Dotted Dark-Gray Line) Starts at approximately 0, remains relatively stable between -5 and 5 across all layers.
**Right Chart: Mistral-7B-v0.3**
* **Q-Anchored (PopQA):** (Solid Blue Line) Starts at approximately 0, decreases sharply to around -50 by layer 10, fluctuates between -40 and -70 until layer 30. Ends around -70.
* **A-Anchored (PopQA):** (Dashed Brown Line) Starts at approximately 0, remains relatively stable between -5 and 5 across all layers.
* **Q-Anchored (TriviaQA):** (Dotted Green Line) Starts at approximately 0, decreases to around -40 by layer 10, fluctuates between -30 and -60 until layer 30. Ends around -60.
* **A-Anchored (TriviaQA):** (Dash-Dotted Pink Line) Starts at approximately 0, decreases to around -30 by layer 10, fluctuates between -30 and -50 until layer 30. Ends around -50.
* **Q-Anchored (HotpotQA):** (Dash-Dotted Dark-Gray Line) Starts at approximately 0, remains relatively stable between -5 and 5 across all layers.
* **A-Anchored (HotpotQA):** (Dotted Red Line) Starts at approximately 0, remains relatively stable between -5 and 10 across all layers.
* **Q-Anchored (NQ):** (Dash-Dotted Light-Purple Line) Starts at approximately 0, decreases to around -30 by layer 10, fluctuates between -30 and -50 until layer 30. Ends around -50.
* **A-Anchored (NQ):** (Dotted Dark-Gray Line) Starts at approximately 0, remains relatively stable between -5 and 5 across all layers.
### Key Observations
* For both Mistral-7B-v0.1 and Mistral-7B-v0.3, the "Q-Anchored" lines for PopQA, TriviaQA, and NQ datasets show a significant decrease in ΔP as the layer number increases, indicating a performance drop.
* The "A-Anchored" lines for all datasets remain relatively stable around 0, suggesting that anchoring with the answer has a different effect on performance across layers compared to anchoring with the question.
* The HotpotQA dataset shows a stable performance for both Q-Anchored and A-Anchored methods.
* Mistral-7B-v0.3 shows a slightly larger decrease in ΔP for Q-Anchored (PopQA) compared to Mistral-7B-v0.1.
### Interpretation
The charts suggest that the performance of Mistral-7B models, particularly when anchored with the question (Q-Anchored), varies significantly across different layers for certain question answering tasks (PopQA, TriviaQA, NQ). The decrease in ΔP indicates that as the model processes information through deeper layers, its performance on these tasks degrades. This could be due to issues like vanishing gradients, overfitting to specific layers, or the accumulation of noise.
The stability of A-Anchored lines suggests that providing the answer as context might mitigate the performance degradation observed with Q-Anchored methods. The consistent performance on HotpotQA might indicate that this dataset is less sensitive to the layer-specific issues affecting the other datasets.
The slight difference between Mistral-7B-v0.1 and Mistral-7B-v0.3, particularly for Q-Anchored (PopQA), suggests that the newer version might have slightly exacerbated the performance degradation issue in deeper layers for this specific task. Further investigation is needed to understand the underlying causes and potential solutions for these performance variations.