## Histogram: Distribution of Thinking Tokens
### Overview
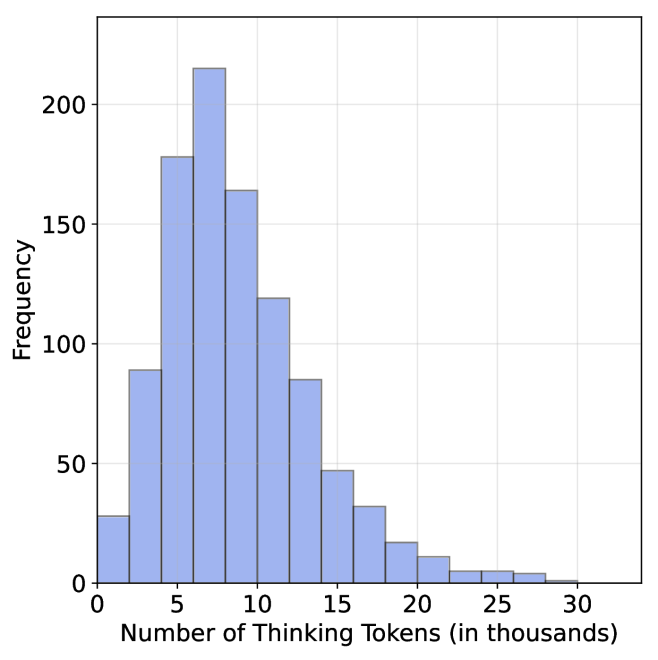
The image is a histogram showing the distribution of "Thinking Tokens" in thousands. The x-axis represents the number of tokens, and the y-axis represents the frequency of occurrence. The histogram bars are light blue.
### Components/Axes
* **X-axis:** "Number of Thinking Tokens (in thousands)". The axis ranges from 0 to 30, with tick marks at intervals of 5 (0, 5, 10, 15, 20, 25, 30).
* **Y-axis:** "Frequency". The axis ranges from 0 to 200, with tick marks at intervals of 50 (0, 50, 100, 150, 200).
### Detailed Analysis
The histogram shows the frequency distribution of the number of thinking tokens. The data appears to be right-skewed, with the highest frequency occurring between 5,000 and 10,000 tokens.
Here's a breakdown of the approximate frequency for each bin:
* 0-5k: Approximately 90
* 5-10k: Approximately 215
* 10-15k: Approximately 165
* 15-20k: Approximately 120
* 20-25k: Approximately 85
* 25-30k: Approximately 50
* 30-35k: Approximately 30
* 35-40k: Approximately 15
* 40-45k: Approximately 10
* 45-50k: Approximately 5
### Key Observations
* The distribution is unimodal, with a peak between 5,000 and 10,000 tokens.
* The frequency decreases as the number of tokens increases beyond 10,000.
* There are relatively few instances with a high number of thinking tokens.
### Interpretation
The histogram suggests that the majority of observations have a relatively low number of "Thinking Tokens". The right skew indicates that while most observations fall within a lower range, there are some instances with significantly higher token counts, pulling the tail of the distribution to the right. This could indicate that some processes or entities require or generate a much larger number of tokens compared to the average. The data could represent the distribution of computational resources used by different tasks, the number of words used in different documents, or any other scenario where "Thinking Tokens" are a relevant metric.