## Histogram: Distribution of Thinking Tokens
### Overview
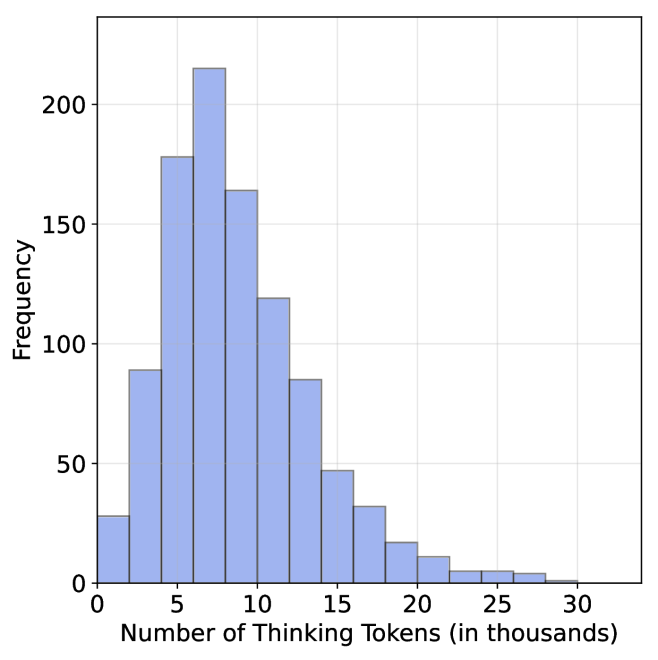
The image is a histogram illustrating the frequency distribution of "Thinking Tokens" utilized by a system (likely an AI model). The distribution is right-skewed, indicating that the majority of operations utilize a moderate number of tokens, while a smaller subset of operations requires significantly higher token counts.
### Components/Axes
* **X-Axis:** Labeled "Number of Thinking Tokens (in thousands)". The scale ranges from 0 to 30, with major grid lines at intervals of 5 (0, 5, 10, 15, 20, 25, 30). Each major interval contains two bars, implying a bin width of 2,500 tokens.
* **Y-Axis:** Labeled "Frequency". The scale ranges from 0 to 200+, with major grid lines at intervals of 50 (0, 50, 100, 150, 200).
* **Data Series:** A single series of light blue bars with dark outlines representing the count of occurrences for each token range bin.
### Detailed Analysis
The histogram displays a unimodal distribution with a peak occurring between 7,500 and 10,000 tokens. Below are the approximate frequency values for each bin (width of 2,500 tokens):
| Token Range (thousands) | Approximate Frequency |
| :--- | :--- |
| 0 – 2.5 | ~30 |
| 2.5 – 5.0 | ~90 |
| 5.0 – 7.5 | ~180 |
| 7.5 – 10.0 | ~215 (Peak) |
| 10.0 – 12.5 | ~165 |
| 12.5 – 15.0 | ~120 |
| 15.0 – 17.5 | ~85 |
| 17.5 – 20.0 | ~45 |
| 20.0 – 22.5 | ~35 |
| 22.5 – 25.0 | ~15 |
| 25.0 – 27.5 | ~10 |
| 27.5 – 30.0 | ~5 |
| > 30.0 | ~2 |
*Note: Values are estimated based on visual alignment with the Y-axis grid lines.*
### Key Observations
* **Peak Concentration:** The highest frequency of operations occurs in the 7,500 to 10,000 token range, with a frequency of approximately 215.
* **Skewness:** The data exhibits a clear right-skew (positive skew). The bulk of the data is concentrated between 5,000 and 15,000 tokens.
* **Rapid Decline:** After the peak at 10,000 tokens, the frequency drops steadily. By the 20,000-token mark, the frequency is significantly lower (below 50).
* **Outliers:** There is a "long tail" extending beyond 25,000 tokens, representing complex tasks that require substantially more processing/thinking time, though these are statistically rare.
### Interpretation
This data suggests that the "thinking" process for this model is generally efficient and bounded. The majority of tasks are resolved within a predictable range of 5,000 to 15,000 tokens.
The sharp drop-off after 15,000 tokens suggests that the model either reaches a conclusion or exhausts its typical reasoning capacity for most queries within this window. The long tail indicates that while the model is capable of extended reasoning (up to 30,000+ tokens), such instances are outliers, likely reserved for highly complex or ambiguous prompts that require deeper deliberation. This distribution is characteristic of systems that employ a "chain-of-thought" or similar reasoning mechanism, where the length of the reasoning process correlates with the complexity of the input.