## Bar Charts: Power and Energy Consumption
### Overview
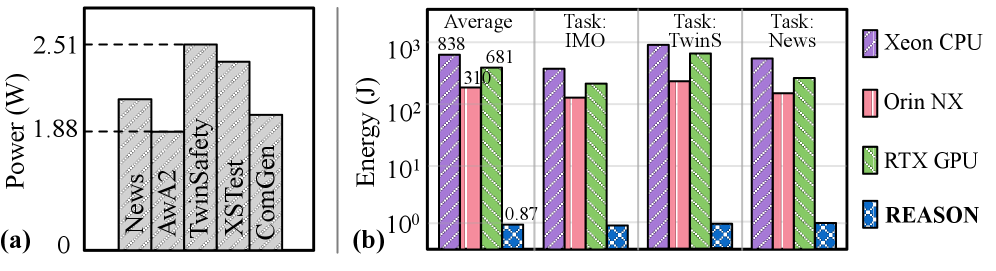
The image contains two bar charts comparing power consumption (in Watts) and energy consumption (in Joules) across different tasks and hardware platforms. Chart (a) shows the power consumption of different tasks, while chart (b) shows the energy consumption of different hardware platforms for various tasks.
### Components/Axes
**Chart (a): Power Consumption**
* **Title:** Power (W)
* **X-axis:** Tasks (News, AwA2, TwinSafety, XSTest, ComGen)
* **Y-axis:** Power in Watts (W), ranging from 0 to approximately 2.51 W. A dashed line indicates 1.88 W.
**Chart (b): Energy Consumption**
* **Title:** Energy (J)
* **X-axis:** Tasks (Average, Task: IMO, Task: TwinS, Task: News)
* **Y-axis:** Energy in Joules (J), using a logarithmic scale from 10^0 to 10^3.
* **Legend (Top-Right):**
* Purple diagonal lines: Xeon CPU
* Pink vertical lines: Orin NX
* Green diagonal lines: RTX GPU
* Blue checkered pattern: REASON
### Detailed Analysis
**Chart (a): Power Consumption**
* **News:** Approximately 2.1 W
* **AwA2:** Approximately 1.8 W
* **TwinSafety:** Approximately 2.5 W
* **XSTest:** Approximately 2.4 W
* **ComGen:** Approximately 1.9 W
**Chart (b): Energy Consumption**
* **Average:**
* Xeon CPU (Purple): Approximately 838 J
* Orin NX (Pink): Approximately 310 J
* RTX GPU (Green): Approximately 681 J
* REASON (Blue): Approximately 0.87 J
* **Task: IMO:**
* Xeon CPU (Purple): Approximately 800 J
* Orin NX (Pink): Approximately 250 J
* RTX GPU (Green): Approximately 500 J
* REASON (Blue): Approximately 0.87 J
* **Task: TwinS:**
* Xeon CPU (Purple): Approximately 1000 J
* Orin NX (Pink): Approximately 300 J
* RTX GPU (Green): Approximately 800 J
* REASON (Blue): Approximately 0.87 J
* **Task: News:**
* Xeon CPU (Purple): Approximately 700 J
* Orin NX (Pink): Approximately 200 J
* RTX GPU (Green): Approximately 600 J
* REASON (Blue): Approximately 0.87 J
### Key Observations
* In Chart (a), TwinSafety and XSTest tasks consume the most power, while AwA2 consumes the least.
* In Chart (b), the Xeon CPU generally consumes the most energy, followed by the RTX GPU and then the Orin NX. The REASON platform consumes significantly less energy than the other platforms.
* The energy consumption varies across different tasks for each hardware platform.
### Interpretation
The charts provide a comparison of power and energy consumption for different tasks and hardware platforms. Chart (a) shows the instantaneous power draw of different tasks, while chart (b) shows the total energy consumed by different hardware platforms to complete those tasks. The data suggests that the REASON platform is significantly more energy-efficient than the Xeon CPU, Orin NX, and RTX GPU. The choice of hardware platform can significantly impact energy consumption, and the REASON platform may be a suitable option for energy-sensitive applications. The different tasks have different power requirements, which may influence the choice of hardware platform for specific applications.