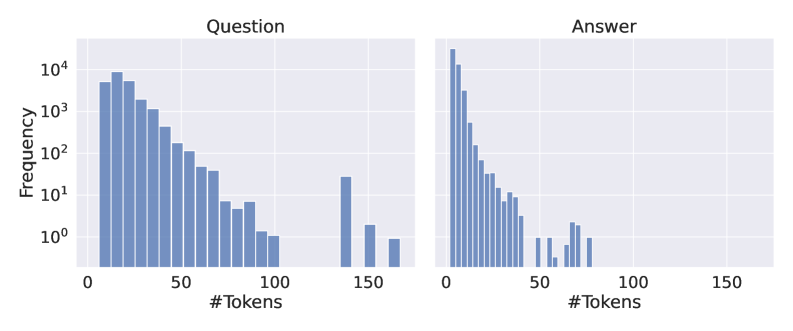
## Histogram: Token Frequency in Questions and Answers
### Overview
The image presents two histograms side-by-side, comparing the frequency of token counts in "Question" and "Answer" texts. The x-axis represents the number of tokens, and the y-axis represents the frequency on a logarithmic scale.
### Components/Axes
* **Titles:** "Question" (left histogram), "Answer" (right histogram)
* **X-axis:** "#Tokens" (both histograms), ranging from 0 to 150.
* **Y-axis:** "Frequency" (both histograms), logarithmic scale ranging from 10^0 (1) to 10^4 (10,000).
* **Bars:** The histograms are composed of vertical bars, where the height of each bar represents the frequency of a specific token count. The bars are a light blue-gray color.
### Detailed Analysis
**Question Histogram:**
* **Trend:** The frequency of questions decreases as the number of tokens increases.
* **Data Points:**
* The highest frequency is observed for questions with a low number of tokens (0-10), with a frequency of approximately 8000.
* The frequency drops significantly between 0 and 50 tokens.
* There are some spikes in frequency around 140 and 150 tokens, but these are much lower than the initial peak.
* Frequency at 50 tokens is approximately 200.
* Frequency at 100 tokens is approximately 1.
**Answer Histogram:**
* **Trend:** Similar to the question histogram, the frequency of answers decreases as the number of tokens increases.
* **Data Points:**
* The highest frequency is observed for answers with a low number of tokens (0-10), with a frequency of approximately 15000.
* The frequency drops significantly between 0 and 50 tokens.
* There are some spikes in frequency around 60, 70, 80, and 90 tokens, but these are much lower than the initial peak.
* Frequency at 50 tokens is approximately 10.
* Frequency at 100 tokens is approximately 1.
### Key Observations
* Both questions and answers exhibit a similar distribution, with a high frequency of short texts and a decreasing frequency as the number of tokens increases.
* Answers appear to have a higher frequency of very short texts (0-10 tokens) compared to questions.
* The frequency of longer texts (50+ tokens) is significantly lower for both questions and answers.
### Interpretation
The histograms suggest that both questions and answers tend to be relatively short in terms of token count. The higher frequency of short answers compared to short questions might indicate that many answers are concise or direct responses. The logarithmic scale emphasizes the rapid decrease in frequency as the token count increases, highlighting the prevalence of shorter texts in the dataset. The spikes at higher token counts could represent specific types of questions or answers that require more detailed explanations.