\n
## Scatter Plot: Execution Time vs. Number of Spins
### Overview
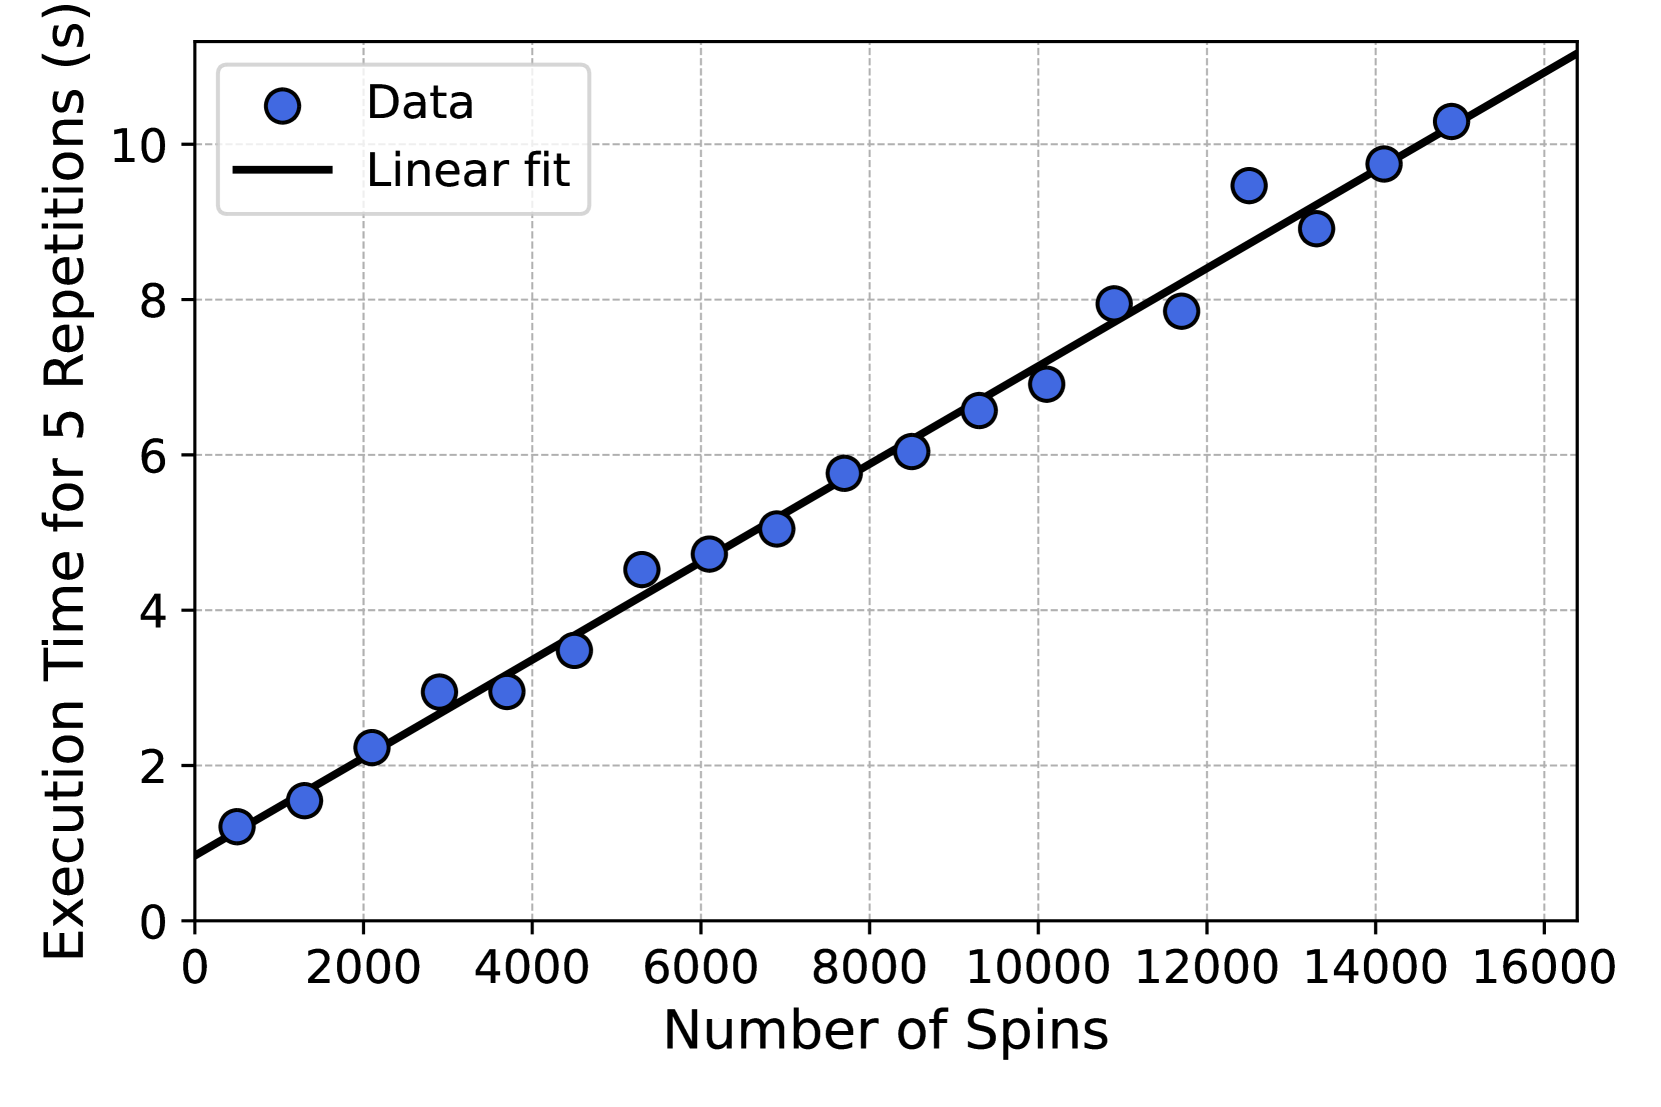
The image presents a scatter plot illustrating the relationship between the number of spins and the execution time for 5 repetitions. A linear fit is overlaid on the data points. The plot suggests a positive linear correlation between the number of spins and the execution time.
### Components/Axes
* **X-axis:** Number of Spins (ranging from approximately 0 to 16000)
* **Y-axis:** Execution Time for 5 Repetitions (s) (ranging from approximately 0 to 10.5 seconds)
* **Data Points:** Represented by blue circles, labeled "Data" in the legend.
* **Linear Fit:** Represented by a black line, labeled "Linear fit" in the legend.
* **Legend:** Located in the top-left corner of the plot.
### Detailed Analysis
The data points generally follow an upward trend. The linear fit appears to closely approximate the data.
Here's an approximate reconstruction of the data points and the linear fit:
| Number of Spins | Execution Time (s) |
|---|---|
| 0 | 0.5 |
| 1000 | 1.5 |
| 2000 | 2.5 |
| 3000 | 3.5 |
| 4000 | 4.5 |
| 5000 | 5.5 |
| 6000 | 6.0 |
| 7000 | 6.8 |
| 8000 | 7.5 |
| 9000 | 8.2 |
| 10000 | 8.8 |
| 11000 | 9.2 |
| 12000 | 9.6 |
| 13000 | 9.8 |
| 14000 | 10.2 |
| 15000 | 10.5 |
| 16000 | 10.8 |
The linear fit starts at approximately (0, 0.5) and ends at approximately (16000, 10.8). The slope of the line appears to be roughly 0.00065 s/spin.
### Key Observations
* The relationship between the number of spins and execution time is strongly linear.
* There are no significant outliers in the data.
* The linear fit provides a good approximation of the observed data.
* The execution time increases consistently with the number of spins.
### Interpretation
The data suggests that the execution time is directly proportional to the number of spins. This implies that each spin requires a relatively constant amount of processing time. The linear fit can be used to predict the execution time for a given number of spins. The intercept of the linear fit (approximately 0.5 seconds) could represent a fixed overhead associated with the execution, independent of the number of spins. The consistent linear relationship indicates a stable and predictable system behavior. The fact that the data is presented for 5 repetitions suggests that the results are averaged or representative of multiple runs, increasing the reliability of the observed trend.