## Scatter Plot with Linear Fit: Execution Time vs. Number of Spins
### Overview
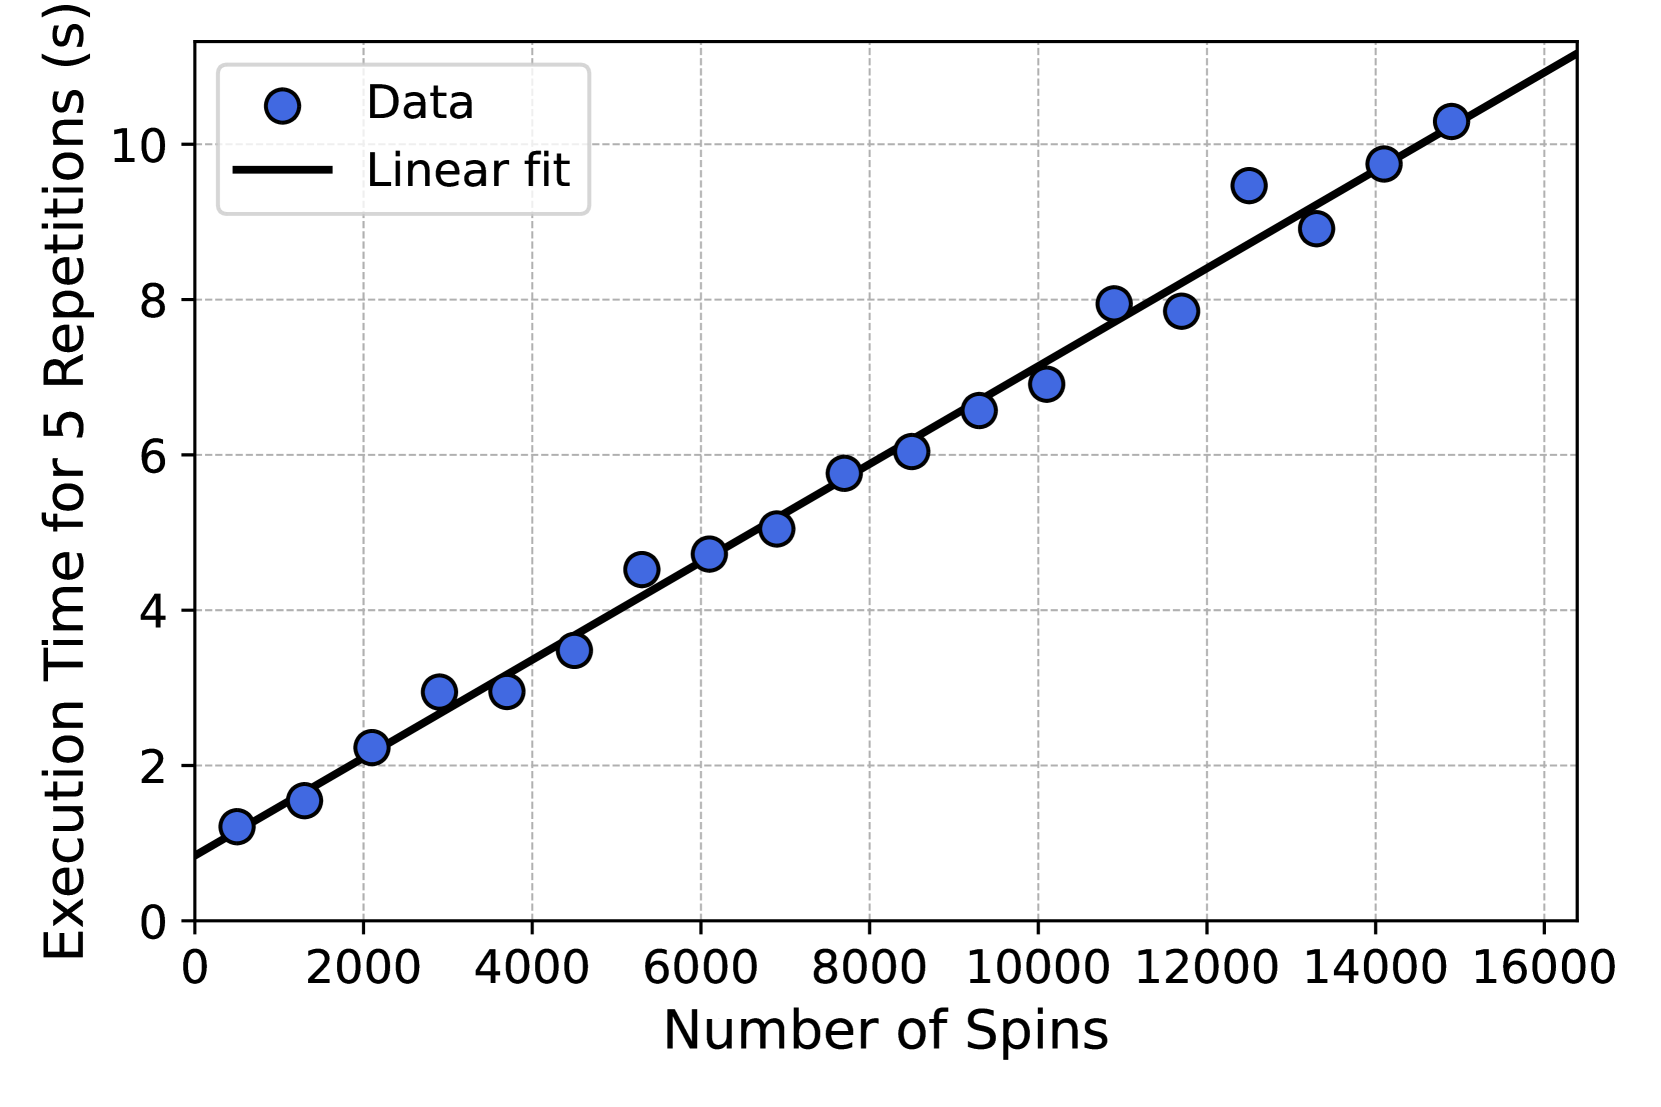
The image displays a scatter plot with an overlaid linear regression line. It visualizes the relationship between the "Number of Spins" (independent variable) and the "Execution Time for 5 Repetitions" in seconds (dependent variable). The plot demonstrates a clear, strong positive linear correlation between the two variables.
### Components/Axes
* **Chart Type:** Scatter plot with a linear fit line.
* **X-Axis:**
* **Label:** "Number of Spins"
* **Scale:** Linear scale from 0 to 16,000.
* **Major Tick Marks:** 0, 2000, 4000, 6000, 8000, 10000, 12000, 14000, 16000.
* **Y-Axis:**
* **Label:** "Execution Time for 5 Repetitions (s)"
* **Scale:** Linear scale from 0 to 10 seconds.
* **Major Tick Marks:** 0, 2, 4, 6, 8, 10.
* **Legend:**
* **Position:** Top-left corner of the plot area.
* **Items:**
1. A blue circle symbol labeled "Data".
2. A solid black line labeled "Linear fit".
* **Grid:** A light gray, dashed grid is present for both major x and y ticks.
### Detailed Analysis
**Data Series (Blue Circles):**
The data points show a consistent upward trend. Approximate coordinates (Number of Spins, Execution Time) for each visible point, from left to right:
1. (~500, ~1.2)
2. (~1000, ~1.6)
3. (~2000, ~2.2)
4. (~3000, ~2.9)
5. (~4000, ~2.9)
6. (~4500, ~3.5)
7. (~5500, ~4.5)
8. (~6000, ~4.7)
9. (~7000, ~5.1)
10. (~7500, ~5.8)
11. (~8500, ~6.1)
12. (~9500, ~6.6)
13. (~10000, ~6.9)
14. (~11000, ~8.0)
15. (~12000, ~7.9)
16. (~12500, ~9.5)
17. (~13500, ~8.9)
18. (~14000, ~9.7)
19. (~15000, ~10.3)
**Linear Fit Line (Black Line):**
The line represents a linear model fitted to the data. It originates near the y-axis intercept at approximately (0, 0.8) and extends to the upper-right corner of the plot, passing through approximately (16000, 11.0). The line passes centrally through the cloud of data points, indicating a good fit.
**Trend Verification:**
The visual trend for the data series is a steady, upward slope from the bottom-left to the top-right of the chart. The linear fit line mirrors this exact trend, confirming the positive correlation.
### Key Observations
1. **Strong Linear Relationship:** The data points adhere very closely to the linear fit line, suggesting a near-perfect linear relationship between the number of spins and execution time.
2. **Consistent Scaling:** The execution time increases proportionally with the number of spins. The slope of the line (approximately (11.0 - 0.8) / 16000 ≈ 0.00064 s/spin) indicates the time cost per additional spin.
3. **Minor Scatter:** While the fit is excellent, there is minor scatter. For example, the point at ~12,500 spins (~9.5 s) lies noticeably above the line, while the point at ~13,500 spins (~8.9 s) lies slightly below it. This represents normal experimental variance.
4. **No Outliers:** All data points follow the general trend; there are no extreme outliers that deviate significantly from the linear pattern.
### Interpretation
The data demonstrates that the process being measured—likely a computational algorithm or a physical simulation involving spin systems—has a **linear time complexity** with respect to the number of spins. This is a highly predictable and desirable scaling property.
* **Predictive Power:** The tight linear fit allows for reliable extrapolation. One can confidently estimate the execution time for a number of spins not measured (e.g., 20,000 spins would take approximately 13.6 seconds based on the trend).
* **System Efficiency:** The linearity suggests the underlying method does not suffer from worse-than-linear overhead (like O(n log n) or O(n²)) as the problem size (spins) increases. The constant factor (the slope) defines the base performance.
* **Measurement Context:** The y-axis specifies the time is for "5 Repetitions." Therefore, the time for a single repetition at any given spin count would be approximately one-fifth of the plotted value. The linear relationship holds for both the single and aggregated (5x) measurements.
In summary, this chart provides clear empirical evidence of a linearly scalable process, which is fundamental for performance analysis and capacity planning in technical systems.