## Chart: Information Gain and R² Value vs. Training Steps
### Overview
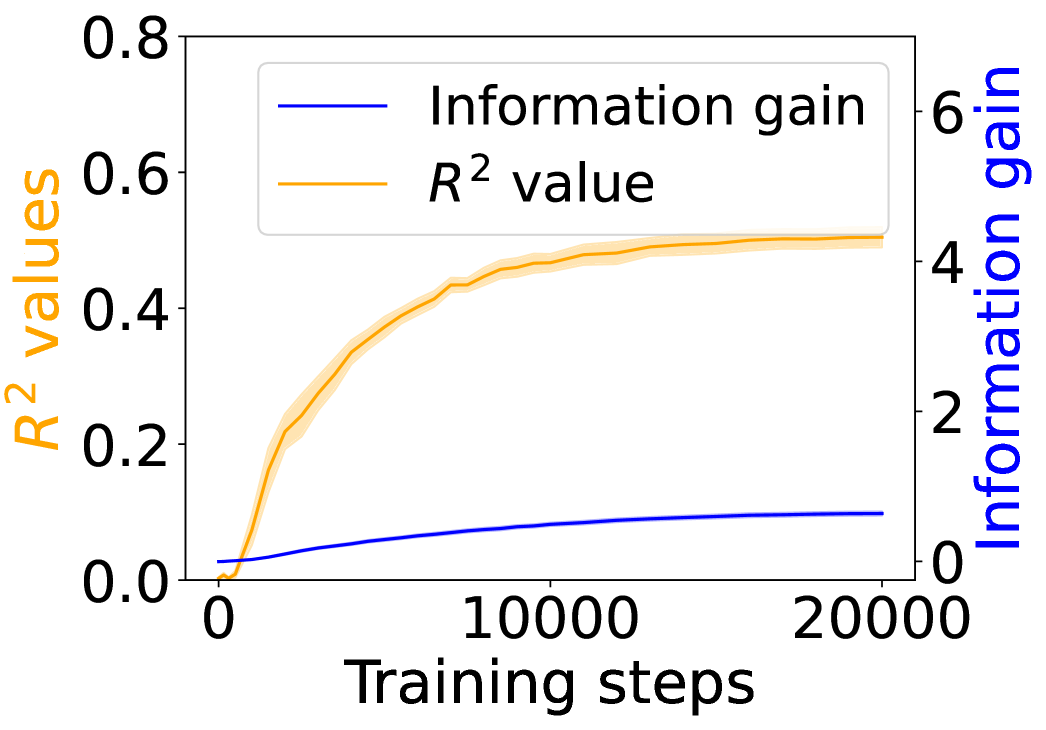
The image is a line chart showing the relationship between training steps and two metrics: Information Gain and R² value. The x-axis represents training steps, while the left y-axis represents R² values and the right y-axis represents Information Gain. The chart displays how these metrics change as the training progresses.
### Components/Axes
* **X-axis:** Training steps, ranging from 0 to 20000.
* **Left Y-axis:** R² values, ranging from 0.0 to 0.8.
* **Right Y-axis:** Information gain, ranging from 0 to 6.
* **Legend:** Located at the top-center of the chart.
* Blue line: Information gain
* Orange line: R² value
### Detailed Analysis
* **R² value (Orange line):** The R² value starts near 0 and increases rapidly until approximately 10000 training steps, after which the rate of increase slows down. The R² value appears to plateau around 0.5 after 15000 training steps. There is a shaded region around the orange line, indicating variability or confidence interval.
* At 0 training steps, R² value is approximately 0.02.
* At 5000 training steps, R² value is approximately 0.35.
* At 10000 training steps, R² value is approximately 0.45.
* At 20000 training steps, R² value is approximately 0.5.
* **Information gain (Blue line):** The information gain starts near 0 and increases slowly throughout the training process. The slope of the line decreases as the number of training steps increases.
* At 0 training steps, Information gain is approximately 0.0.
* At 5000 training steps, Information gain is approximately 0.5.
* At 10000 training steps, Information gain is approximately 0.7.
* At 20000 training steps, Information gain is approximately 1.0.
### Key Observations
* The R² value increases much more rapidly than the information gain during the initial training phase.
* The R² value plateaus at a higher level than the information gain.
* Both metrics show diminishing returns as the number of training steps increases.
### Interpretation
The chart suggests that the model's performance, as measured by the R² value, improves significantly during the initial training phase. However, after a certain number of training steps (around 10000), the improvement in R² value diminishes. The information gain also increases with training steps, but at a slower rate and to a lesser extent than the R² value. This indicates that the model is learning, but the rate of learning decreases over time. The plateauing of the R² value suggests that the model may be approaching its maximum performance on the given task or dataset. Further training may not lead to significant improvements.