## Dual-Axis Line Chart: Training Progress of R² Value and Information Gain
### Overview
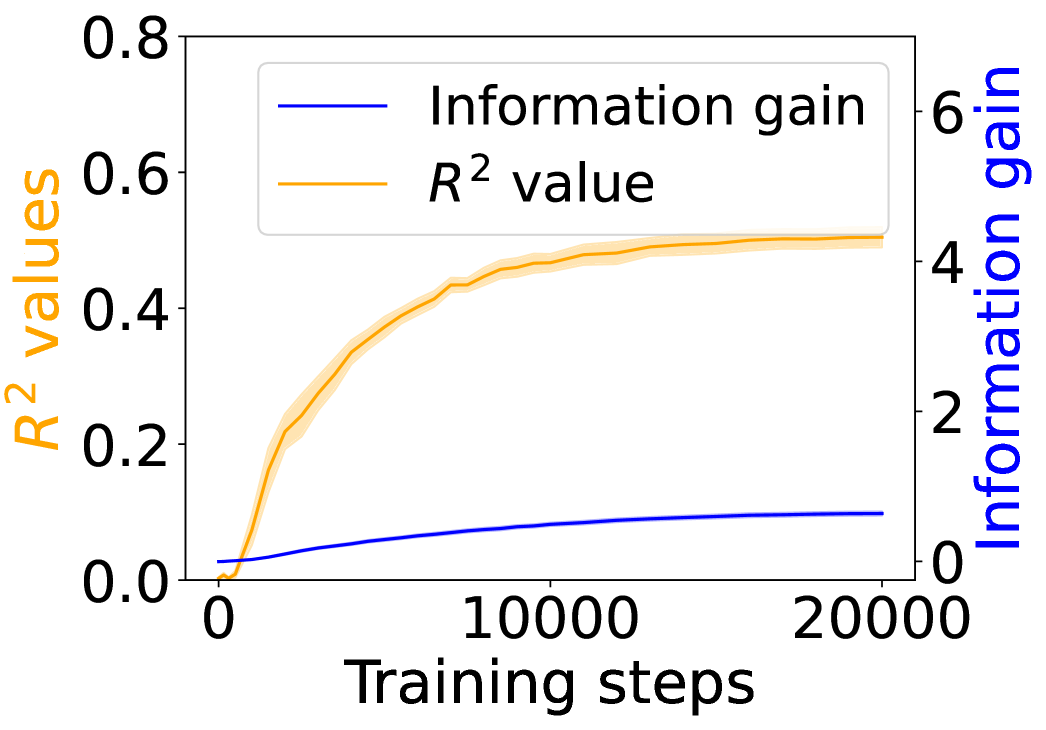
This image is a dual-axis line chart illustrating the progression of two distinct metrics—R² value and Information gain—over the course of 20,000 training steps. The chart uses two separate y-axes to accommodate the different scales of the metrics, with shaded bands around each line indicating variability or confidence intervals.
### Components/Axes
* **X-Axis (Bottom):**
* **Label:** "Training steps"
* **Scale:** Linear, from 0 to 20,000.
* **Major Ticks:** 0, 10000, 20000.
* **Primary Y-Axis (Left):**
* **Label:** "R² values" (text is orange, matching its data series).
* **Scale:** Linear, from 0.0 to 0.8.
* **Major Ticks:** 0.0, 0.2, 0.4, 0.6, 0.8.
* **Secondary Y-Axis (Right):**
* **Label:** "Information gain" (text is blue, matching its data series).
* **Scale:** Linear, from 0 to 6.
* **Major Ticks:** 0, 2, 4, 6.
* **Legend (Top-Left Corner):**
* A blue line segment is labeled "Information gain".
* An orange line segment is labeled "R² value".
### Detailed Analysis
**1. R² Value (Orange Line, Left Y-Axis):**
* **Trend Verification:** The orange line shows a steep, concave-down increase that gradually plateaus. It starts near 0, rises rapidly in the first ~5,000 steps, and then the rate of increase slows significantly, approaching an asymptote.
* **Data Points (Approximate):**
* Step 0: ~0.0
* Step 2,500: ~0.25
* Step 5,000: ~0.40
* Step 10,000: ~0.48
* Step 15,000: ~0.50
* Step 20,000: ~0.51
* **Uncertainty Band:** A semi-transparent orange shaded region surrounds the main line, indicating the range of variability. The band is narrowest at the start and end, and widest during the period of steepest ascent (approx. steps 2,000-7,000).
**2. Information Gain (Blue Line, Right Y-Axis):**
* **Trend Verification:** The blue line shows a steady, near-linear increase with a very slight upward curvature. It starts near 0 and grows consistently throughout the training steps.
* **Data Points (Approximate):**
* Step 0: ~0.0
* Step 5,000: ~0.4
* Step 10,000: ~0.7
* Step 15,000: ~0.9
* Step 20,000: ~1.0
* **Uncertainty Band:** A very faint, narrow blue shaded region is visible around the line, suggesting low variance in this metric compared to the R² value.
### Key Observations
1. **Divergent Scales:** The two metrics operate on vastly different scales. The R² value (0-0.8) is an order of magnitude smaller than the potential range of Information gain (0-6), though the observed gain only reaches ~1.0.
2. **Asymptotic vs. Linear Growth:** The R² value exhibits classic learning curve behavior—rapid initial improvement followed by diminishing returns. In contrast, Information gain shows sustained, nearly linear growth, suggesting it continues to accumulate steadily even as the model's predictive power (R²) stabilizes.
3. **Correlation of Variance:** The period of highest uncertainty (widest orange band) for the R² value coincides with its phase of most rapid change, which is typical in model training.
### Interpretation
This chart demonstrates the relationship between a model's explanatory power (R²) and the amount of new information it acquires during training. The data suggests that:
* **Early Training is Efficient:** The model quickly learns the most significant patterns, leading to a sharp rise in R².
* **Plateauing Performance:** After about 10,000 steps, additional training yields minimal gains in R², indicating the model is approaching its capacity for the given task/data.
* **Continuous Learning:** The steady rise in Information gain implies that even after R² plateaus, the model continues to refine its internal representations or learn subtler, less impactful patterns. This could be beneficial for generalization or robustness, even if it doesn't improve the primary fit metric.
* **Metric Selection:** The choice of metric significantly impacts the interpretation of "progress." Monitoring only R² might suggest training can stop around step 10,000, while Information gain suggests valuable learning continues beyond that point. This highlights the importance of using complementary metrics to evaluate model training.