## Line Graph: Training Performance Metrics
### Overview
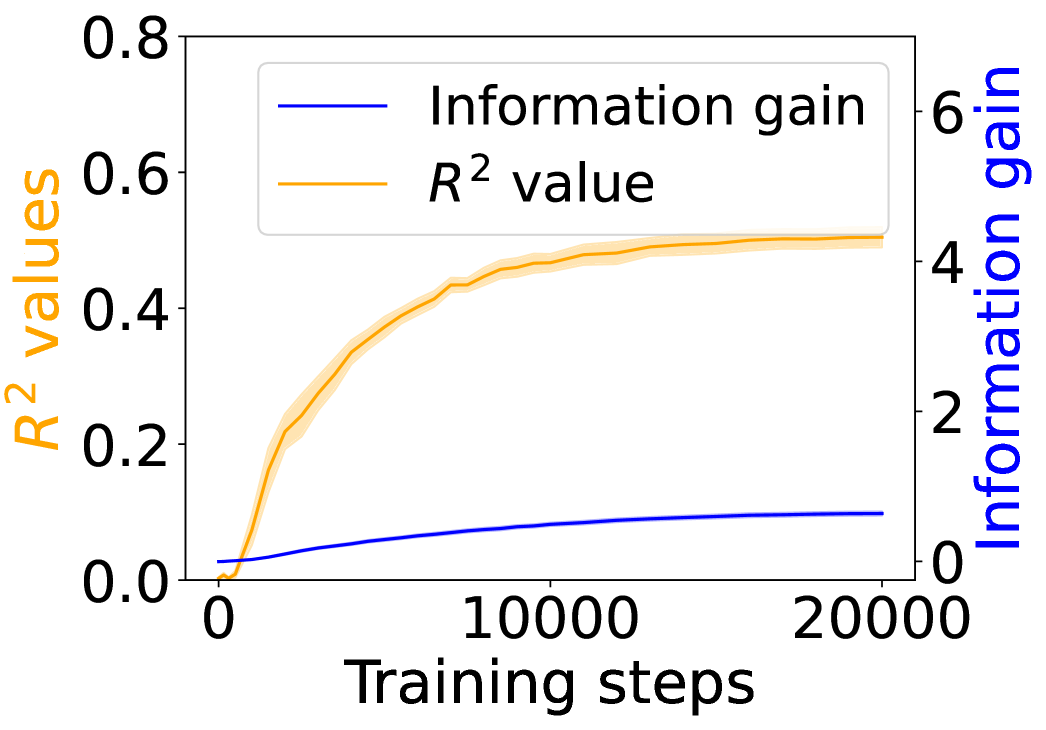
The image depicts a line graph comparing two performance metrics ("Information gain" and "R² value") across training steps. The graph includes two y-axes: the left axis measures "R² values" (0–0.8), and the right axis measures "Information gain" (0–6). The x-axis represents "Training steps" (0–20,000). Two data series are plotted: a blue line for "Information gain" and an orange line for "R² value," with a shaded uncertainty region around the orange line.
### Components/Axes
- **X-axis**: "Training steps" (0–20,000), with tick marks at 0, 10,000, and 20,000.
- **Left Y-axis**: "R² values" (0–0.8), with increments of 0.2.
- **Right Y-axis**: "Information gain" (0–6), with increments of 2.
- **Legend**: Located in the top-right corner, with:
- Blue line: "Information gain"
- Orange line: "R² value"
- **Shaded Region**: Light orange area surrounding the orange line, indicating uncertainty in "R² value" estimates.
### Detailed Analysis
1. **R² Value (Orange Line)**:
- Starts at 0 at 0 training steps.
- Rises sharply to ~0.6 by 10,000 steps.
- Plateaus near 0.6–0.7 by 20,000 steps.
- Shaded uncertainty region widens slightly during the initial rise but narrows as the line plateaus.
2. **Information Gain (Blue Line)**:
- Starts near 0 at 0 training steps.
- Increases gradually, reaching ~0.1 by 20,000 steps.
- Remains relatively flat after ~5,000 steps.
3. **Axis Inconsistencies**:
- The right y-axis ("Information gain") scales to 6, but the blue line never exceeds ~0.1, suggesting a potential mismatch in axis scaling or data representation.
### Key Observations
- **R² Value**: Rapid improvement in early training steps, followed by saturation, indicating diminishing returns.
- **Information Gain**: Minimal improvement over training steps, suggesting limited sensitivity to additional training.
- **Uncertainty**: The shaded region around the orange line highlights variability in "R² value" estimates, particularly during the initial rise.
- **Axis Mismatch**: The right y-axis ("Information gain") scale (0–6) does not align with the blue line's actual values (~0–0.1), raising questions about visualization accuracy.
### Interpretation
The data suggests that the model's performance, as measured by "R² value," improves significantly during early training but plateaus by ~10,000 steps, indicating potential overfitting or model saturation. In contrast, "Information gain" shows minimal improvement, implying that additional training steps may not meaningfully enhance the model's ability to capture relevant information. The shaded uncertainty region around "R² value" underscores variability in early-stage performance estimates, which could reflect instability in the model's learning process. The discrepancy between the right y-axis scale and the blue line's values warrants further investigation, as it may misrepresent the magnitude of "Information gain" relative to "R² value."