TECHNICAL ASSET FINGERPRINT
ef0f2e3c22e41363867f60c5
Click to view fullscreen
Press ESC or click to close
FOUND IN PAPERS
EXPERT: healer-alpha-free VERSION 1
RUNTIME: free/openrouter/healer-alpha
INTEL_VERIFIED
## Diagram: Distributed Training Synchronization Strategies
### Overview
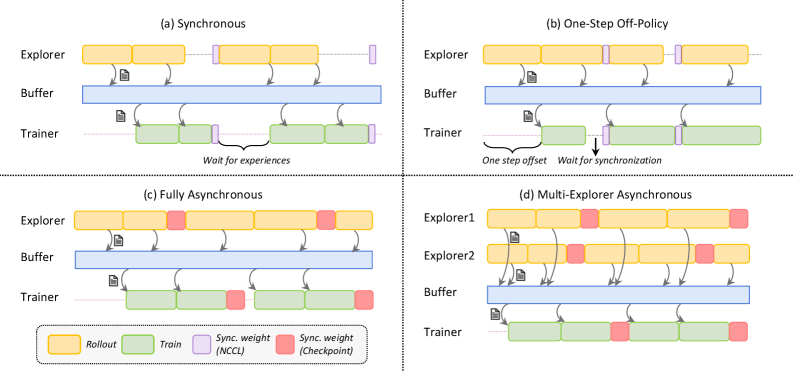
The image is a technical diagram illustrating four different synchronization architectures for distributed reinforcement learning (RL) or similar agent-based training systems. It compares how data collection ("Explorer"), experience storage ("Buffer"), and model training ("Trainer") components are coordinated in time. The diagram is divided into four quadrants, each labeled with a strategy name: (a) Synchronous, (b) One-Step Off-Policy, (c) Fully Asynchronous, and (d) Multi-Explorer Asynchronous.
### Components/Axes
The diagram does not have traditional axes. It uses a consistent visual language across all four sub-diagrams:
* **Primary Components (Vertical Layout):**
* **Explorer:** Top row. Represents the data collection or rollout process.
* **Buffer:** Middle row. Represents the experience replay buffer where collected data is stored.
* **Trainer:** Bottom row. Represents the model training process.
* **Temporal Flow:** Time progresses from left to right. Horizontal bars represent the duration of a process phase.
* **Legend (Bottom Center):**
* **Yellow Bar:** `Rollout` (Data collection phase by Explorer).
* **Green Bar:** `Train` (Model training phase by Trainer).
* **Purple Bar:** `Sync. weight (NCCL)` (Synchronization of model weights using NCCL, a high-speed communication library).
* **Red Bar:** `Sync. weight (Checkpoint)` (Synchronization via saving/loading model checkpoints to/from storage).
* **Data Flow Arrows:** Curved arrows indicate the flow of data (experiences) from Explorer to Buffer and from Buffer to Trainer. Small document icons next to arrows signify data batches.
* **Synchronization Annotations:** Text labels and vertical dashed lines indicate waiting periods and synchronization points.
### Detailed Analysis
#### Sub-diagram (a): Synchronous
* **Flow:** The Explorer completes a `Rollout` (yellow), sends data to the Buffer, and then waits. The Trainer then performs a `Train` step (green) using data from the Buffer. After training, the Trainer sends updated weights (purple `Sync. weight (NCCL)`) back to the Explorer. The Explorer cannot start its next rollout until it receives these updated weights.
* **Key Annotation:** A brace under the Trainer's timeline is labeled `"Wait for experiences"`, indicating the Trainer is idle until new data arrives from the Explorer.
* **Pattern:** Strictly sequential and locked-step. The system throughput is limited by the slowest component in each cycle.
#### Sub-diagram (b): One-Step Off-Policy
* **Flow:** Similar to (a), but with a critical offset. The Explorer starts its next `Rollout` immediately after sending data to the Buffer, without waiting for the Trainer to finish. The Trainer runs `Train` steps on slightly older data from the Buffer.
* **Key Annotations:**
* `"One step offset"` with a downward arrow points to the start of the Trainer's first `Train` block, showing it lags one rollout behind the Explorer.
* `"Wait for synchronization"` with a brace shows the Explorer pausing before its second rollout, waiting for a `Sync. weight (NCCL)` (purple) from the Trainer.
* **Pattern:** Introduces a one-step delay (off-policy) to allow some parallelism, but still requires periodic weight synchronization.
#### Sub-diagram (c): Fully Asynchronous
* **Flow:** The Explorer continuously performs `Rollout` phases (yellow) and sends data to the Buffer without any waiting. The Trainer continuously performs `Train` phases (green) on data from the Buffer. There are no purple `Sync. weight (NCCL)` bars. Instead, red `Sync. weight (Checkpoint)` bars appear at the end of some `Train` phases, indicating asynchronous checkpoint-based weight updates.
* **Pattern:** Fully decoupled Explorer and Trainer. They operate independently at their own pace. Weight synchronization is infrequent and happens via checkpoints, not direct communication.
#### Sub-diagram (d): Multi-Explorer Asynchronous
* **Flow:** This extends the asynchronous model. Two Explorers (`Explorer1`, `Explorer2`) operate in parallel, both performing `Rollout` phases (yellow) and sending data to a shared Buffer. Their timelines are offset. A single Trainer performs `Train` phases (green) on the aggregated data. Like (c), synchronization uses red `Sync. weight (Checkpoint)` bars.
* **Pattern:** Maximizes data collection throughput by parallelizing explorers. The Trainer consumes data from multiple sources asynchronously.
### Key Observations
1. **Increasing Asynchrony:** The progression from (a) to (d) shows a clear trend towards decoupling the Explorer and Trainer processes to improve system utilization and throughput.
2. **Synchronization Mechanism Shift:** Strategies (a) and (b) rely on fast, direct weight synchronization (`NCCL`, purple). Strategies (c) and (d) abandon this for less frequent, checkpoint-based synchronization (`Checkpoint`, red), which is simpler but introduces greater model staleness.
3. **Bottleneck Identification:** In (a), the "Wait for experiences" annotation explicitly identifies the Trainer as the bottleneck when it's idle. The other designs aim to eliminate such idle times.
4. **Complexity vs. Performance:** The architectures trade off implementation complexity and algorithmic stability (synchronous is simpler and more stable) for potential performance gains (asynchronous can be faster but may suffer from stale gradients or data).
### Interpretation
This diagram is a conceptual guide for designing distributed RL training systems. It visually argues that moving from synchronous to asynchronous architectures can alleviate system bottlenecks and increase training speed.
* **Synchronous (a):** Represents the baseline. It's easy to reason about and stable but inefficient, as the entire system waits for the slowest operation in each cycle.
* **One-Step Off-Policy (b):** A pragmatic compromise. It introduces a small, controlled delay (one step) to enable overlap between collection and training, boosting efficiency while maintaining relatively tight coupling for model updates.
* **Fully Asynchronous (c) & Multi-Explorer (d):** Represent high-performance, scalable designs. They treat the Explorer and Trainer as independent services communicating through a shared buffer. This maximizes hardware utilization but introduces challenges like training on stale data (the "staleness" problem in distributed ML) and requires careful tuning to ensure learning stability. The multi-explorer variant (d) further scales data ingestion, which is often the primary bottleneck in real-world RL.
The choice between these strategies involves a fundamental trade-off between **system throughput** and **learning efficiency/stability**. The diagram helps engineers visualize this trade-off by mapping the flow of data and control, making it easier to select an architecture based on their specific constraints (e.g., number of GPUs, need for training speed vs. final model performance).
DECODING INTELLIGENCE...