## Line Chart: I-Don't-Know Rate vs. Layer for Llama-3.2-1B and Llama-3.2-3B
### Overview
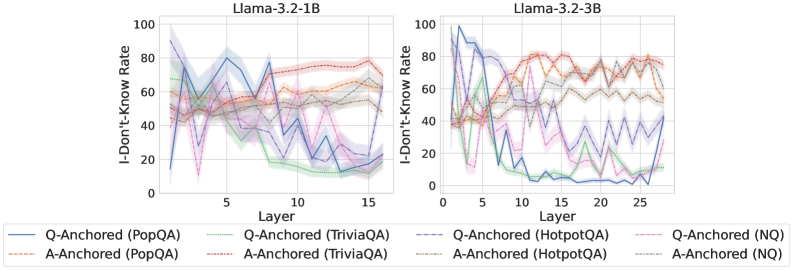
The image presents two line charts comparing the "I-Don't-Know Rate" across different layers of two language models, Llama-3.2-1B and Llama-3.2-3B. Each chart displays six data series, representing different question-answering datasets (PopQA, TriviaQA, HotpotQA, NQ) anchored by either the question (Q-Anchored) or the answer (A-Anchored). The x-axis represents the layer number, and the y-axis represents the I-Don't-Know Rate in percentage.
### Components/Axes
**Left Chart (Llama-3.2-1B):**
* **Title:** Llama-3.2-1B
* **X-axis:** Layer, with markers at 0, 5, 10, and 15.
* **Y-axis:** I-Don't-Know Rate, ranging from 0 to 100. Markers at 0, 20, 40, 60, 80, and 100.
**Right Chart (Llama-3.2-3B):**
* **Title:** Llama-3.2-3B
* **X-axis:** Layer, with markers at 0, 5, 10, 15, 20, and 25.
* **Y-axis:** I-Don't-Know Rate, ranging from 0 to 100. Markers at 0, 20, 40, 60, 80, and 100.
**Legend (Located below both charts):**
* **Q-Anchored (PopQA):** Solid blue line
* **A-Anchored (PopQA):** Dashed brown line
* **Q-Anchored (TriviaQA):** Dotted green line
* **A-Anchored (TriviaQA):** Dashed-dotted pink line
* **Q-Anchored (HotpotQA):** Dashed-dotted red line
* **A-Anchored (HotpotQA):** Dotted gray line
* **Q-Anchored (NQ):** Dashed purple line
* **A-Anchored (NQ):** Dotted black line
### Detailed Analysis
**Left Chart (Llama-3.2-1B):**
* **Q-Anchored (PopQA):** (Solid blue line) Starts around 15 at layer 0, peaks around 80 at layer 6, then decreases to around 20 at layer 15.
* **A-Anchored (PopQA):** (Dashed brown line) Starts around 50 at layer 0, fluctuates between 40 and 60, and ends around 70 at layer 15.
* **Q-Anchored (TriviaQA):** (Dotted green line) Starts around 70 at layer 0, decreases to around 10 at layer 15.
* **A-Anchored (TriviaQA):** (Dashed-dotted pink line) Starts around 50 at layer 0, fluctuates between 20 and 60, and ends around 20 at layer 15.
* **Q-Anchored (HotpotQA):** (Dashed-dotted red line) Starts around 50 at layer 0, fluctuates between 50 and 80, and ends around 70 at layer 15.
* **A-Anchored (HotpotQA):** (Dotted gray line) Starts around 50 at layer 0, fluctuates between 40 and 60, and ends around 50 at layer 15.
* **Q-Anchored (NQ):** (Dashed purple line) Starts around 50 at layer 0, fluctuates between 20 and 60, and ends around 20 at layer 15.
* **A-Anchored (NQ):** (Dotted black line) Starts around 50 at layer 0, fluctuates between 40 and 60, and ends around 50 at layer 15.
**Right Chart (Llama-3.2-3B):**
* **Q-Anchored (PopQA):** (Solid blue line) Starts around 90 at layer 0, decreases to around 10 at layer 15, and remains low until layer 27.
* **A-Anchored (PopQA):** (Dashed brown line) Starts around 50 at layer 0, fluctuates between 50 and 70, and ends around 60 at layer 27.
* **Q-Anchored (TriviaQA):** (Dotted green line) Starts around 70 at layer 0, decreases to around 10 at layer 15, and remains low until layer 27.
* **A-Anchored (TriviaQA):** (Dashed-dotted pink line) Starts around 50 at layer 0, fluctuates between 20 and 60, and ends around 40 at layer 27.
* **Q-Anchored (HotpotQA):** (Dashed-dotted red line) Starts around 50 at layer 0, fluctuates between 70 and 80, and ends around 80 at layer 27.
* **A-Anchored (HotpotQA):** (Dotted gray line) Starts around 50 at layer 0, fluctuates between 60 and 70, and ends around 60 at layer 27.
* **Q-Anchored (NQ):** (Dashed purple line) Starts around 50 at layer 0, fluctuates between 20 and 60, and ends around 40 at layer 27.
* **A-Anchored (NQ):** (Dotted black line) Starts around 50 at layer 0, fluctuates between 50 and 70, and ends around 60 at layer 27.
### Key Observations
* For both models, the "Q-Anchored (PopQA)" and "Q-Anchored (TriviaQA)" series show a significant decrease in the "I-Don't-Know Rate" as the layer number increases, especially in the Llama-3.2-3B model.
* The "A-Anchored (HotpotQA)" series consistently shows a higher "I-Don't-Know Rate" compared to other series in both models.
* The Llama-3.2-3B model exhibits a more pronounced decrease in the "I-Don't-Know Rate" for "Q-Anchored (PopQA)" and "Q-Anchored (TriviaQA)" compared to the Llama-3.2-1B model.
* The "I-Don't-Know Rate" for "A-Anchored" series generally fluctuates within a narrower range compared to the "Q-Anchored" series.
### Interpretation
The data suggests that the Llama-3.2-3B model is more effective at reducing the "I-Don't-Know Rate" for question-anchored PopQA and TriviaQA datasets as the layer number increases. This could indicate that the model learns to better understand and answer questions from these datasets as it processes information through deeper layers. The higher "I-Don't-Know Rate" for the "A-Anchored (HotpotQA)" series might indicate that the model struggles with answering questions when the answer is the primary anchor, especially for the HotpotQA dataset, which is known for its complexity. The difference in performance between the two models could be attributed to the increased number of layers in the Llama-3.2-3B model, allowing it to learn more complex relationships and patterns in the data. The fluctuations in the "I-Don't-Know Rate" for the "A-Anchored" series might indicate that the model's ability to answer questions based on the answer anchor is less consistent across different layers.