## Line Chart: EGA vs. Episode for Different α_i Values
### Overview
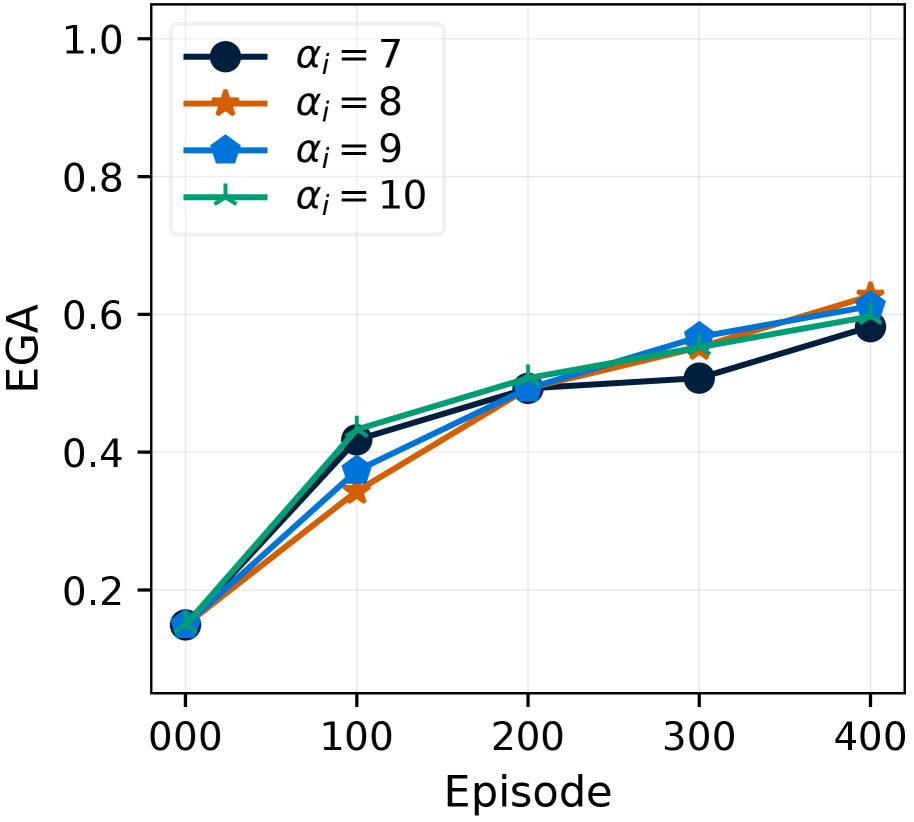
The image displays a line chart plotting the metric "EGA" against "Episode" for four different series, each corresponding to a distinct value of a parameter labeled α_i. The chart shows the progression of EGA over 400 episodes, with all series starting at the same point and exhibiting an upward trend, though with different trajectories and final values.
### Components/Axes
* **Chart Type:** Multi-series line chart with markers.
* **X-Axis:**
* **Label:** "Episode"
* **Scale:** Linear, ranging from 0 to 400.
* **Major Tick Marks:** 000, 100, 200, 300, 400.
* **Y-Axis:**
* **Label:** "EGA"
* **Scale:** Linear, ranging from 0.0 to 1.0.
* **Major Tick Marks:** 0.0, 0.2, 0.4, 0.6, 0.8, 1.0.
* **Legend:** Positioned in the top-left quadrant of the plot area. It contains four entries:
1. **Dark Blue Line with Circle Marker:** Labeled "α_i = 7"
2. **Orange Line with Star Marker:** Labeled "α_i = 8"
3. **Blue Line with Pentagon Marker:** Labeled "α_i = 9"
4. **Green Line with Cross ('x') Marker:** Labeled "α_i = 10"
### Detailed Analysis
**Data Series and Approximate Values:**
All four series begin at Episode 0 with an EGA value of approximately 0.15.
1. **α_i = 7 (Dark Blue, Circles):**
* **Trend:** Shows the most gradual and steady increase among the series after the initial jump.
* **Data Points (Episode, EGA):** (0, ~0.15), (100, ~0.42), (200, ~0.49), (300, ~0.51), (400, ~0.58).
2. **α_i = 8 (Orange, Stars):**
* **Trend:** Has the lowest value at Episode 100 but exhibits the strongest growth in the later episodes (300-400), ending with the highest final EGA.
* **Data Points (Episode, EGA):** (0, ~0.15), (100, ~0.34), (200, ~0.49), (300, ~0.55), (400, ~0.63).
3. **α_i = 9 (Blue, Pentagons):**
* **Trend:** Follows a path very similar to α_i=10, closely tracking it until Episode 300 where it is slightly higher, before converging near the same final value.
* **Data Points (Episode, EGA):** (0, ~0.15), (100, ~0.38), (200, ~0.50), (300, ~0.57), (400, ~0.61).
4. **α_i = 10 (Green, Crosses):**
* **Trend:** Shows the highest value at Episode 100, indicating the fastest initial improvement. Its growth rate then moderates.
* **Data Points (Episode, EGA):** (0, ~0.15), (100, ~0.44), (200, ~0.51), (300, ~0.56), (400, ~0.60).
**Cross-Reference Check:** The legend colors and markers were verified against the lines on the chart. The dark blue circle line corresponds to α_i=7, the orange star line to α_i=8, the blue pentagon line to α_i=9, and the green cross line to α_i=10.
### Key Observations
1. **Common Origin:** All series start at the identical point (Episode 0, EGA ≈ 0.15).
2. **Universal Growth:** Every series shows a positive correlation between Episode and EGA; the metric improves over time for all tested α_i values.
3. **Initial Divergence (Episode 0-100):** The series diverge significantly in the first 100 episodes. α_i=10 shows the fastest initial gain, while α_i=8 shows the slowest.
4. **Mid-Chart Convergence (Episode 200):** All four lines converge closely around Episode 200, with EGA values clustered near 0.5.
5. **Final Ranking (Episode 400):** The final EGA values at Episode 400, from highest to lowest, are: α_i=8 (~0.63) > α_i=9 (~0.61) > α_i=10 (~0.60) > α_i=7 (~0.58). The spread is relatively narrow (≈0.05).
6. **Diminishing Returns:** The rate of increase (slope) for all lines is steepest between Episodes 0-100 and generally flattens in subsequent intervals, suggesting diminishing returns as episodes increase.
### Interpretation
This chart likely visualizes the performance (measured by EGA) of a learning system or algorithm over training episodes, where α_i is a key hyperparameter. The data suggests:
* **Hyperparameter Sensitivity:** The choice of α_i affects the learning trajectory. A higher α_i (e.g., 10) may accelerate early learning, while a moderate value (e.g., 8) might lead to better long-term performance, albeit with a slower start.
* **Convergence Behavior:** The system's performance tends to converge across different hyperparameter settings over time (around Episode 200), but the final asymptotic performance can still differ.
* **Optimal Setting:** Based solely on the final data point at Episode 400, α_i=8 yields the highest EGA. However, the optimal choice could depend on the operational context: if early performance is critical, α_i=10 is preferable; if final performance is the sole metric, α_i=8 is best.
* **Underlying Process:** The consistent upward trend and eventual flattening are characteristic of learning curves, indicating the system is successfully improving but approaching a performance plateau. The narrow final spread suggests the system is relatively robust to variations in α_i within the tested range (7-10).