\n
## Charts: Training Loss vs. Parameters & Loss Distribution
### Overview
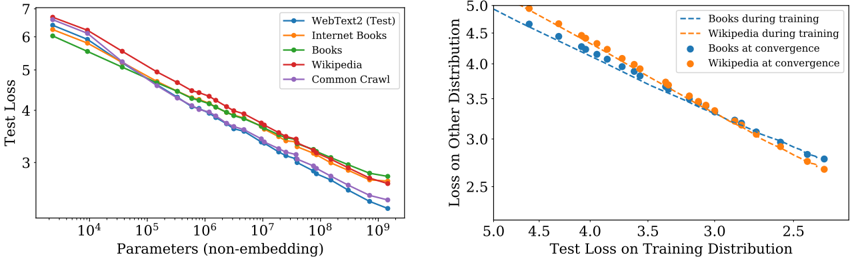
The image presents two charts. The left chart depicts the relationship between the number of parameters (non-embedding) and the test loss for different datasets. The right chart shows the loss on another distribution plotted against the test loss on the training distribution, for Books and Wikipedia datasets during training and at convergence.
### Components/Axes
**Left Chart:**
* **X-axis:** Parameters (non-embedding), logarithmic scale from approximately 10<sup>4</sup> to 10<sup>9</sup>.
* **Y-axis:** Test Loss, linear scale from approximately 2.5 to 7.
* **Data Series:**
* WebText2 (Test) - Blue line
* Internet Books - Orange line
* Books - Green line
* Wikipedia - Yellow line
* Common Crawl - Purple line
**Right Chart:**
* **X-axis:** Test Loss on Training Distribution, linear scale from approximately 2.0 to 5.0.
* **Y-axis:** Loss on Other Distribution, linear scale from approximately 2.5 to 5.0.
* **Data Series:**
* Books during training - Light blue dashed line
* Wikipedia during training - Orange dashed line
* Books at convergence - Blue dots
* Wikipedia at convergence - Orange dots
### Detailed Analysis or Content Details
**Left Chart:**
* **WebText2 (Test):** The blue line starts at approximately 6.2 at 10<sup>4</sup> parameters and decreases steadily to approximately 2.7 at 10<sup>9</sup> parameters.
* **Internet Books:** The orange line starts at approximately 6.0 at 10<sup>4</sup> parameters and decreases to approximately 3.2 at 10<sup>9</sup> parameters.
* **Books:** The green line starts at approximately 6.1 at 10<sup>4</sup> parameters and decreases to approximately 3.0 at 10<sup>9</sup> parameters.
* **Wikipedia:** The yellow line starts at approximately 6.1 at 10<sup>4</sup> parameters and decreases to approximately 3.1 at 10<sup>9</sup> parameters.
* **Common Crawl:** The purple line starts at approximately 6.3 at 10<sup>4</sup> parameters and decreases to approximately 3.3 at 10<sup>9</sup> parameters.
* All lines exhibit a decreasing trend, indicating that increasing the number of parameters generally reduces the test loss. The rate of decrease slows down as the number of parameters increases.
**Right Chart:**
* **Books during training:** The light blue dashed line starts at approximately (4.8, 4.8) and decreases to approximately (2.5, 3.0).
* **Wikipedia during training:** The orange dashed line starts at approximately (4.8, 4.6) and decreases to approximately (2.5, 3.1).
* **Books at convergence:** The blue dots are at approximately (3.0, 3.0), (3.2, 2.8), (3.5, 2.6), (4.0, 2.5), (4.5, 2.4).
* **Wikipedia at convergence:** The orange dots are at approximately (3.0, 3.2), (3.2, 2.9), (3.5, 2.7), (4.0, 2.6), (4.5, 2.5).
* Both datasets show a negative correlation between test loss on the training distribution and loss on the other distribution.
### Key Observations
* In the left chart, WebText2 consistently exhibits the lowest test loss across all parameter ranges.
* The rate of loss reduction diminishes as the number of parameters increases for all datasets.
* In the right chart, the training curves (dashed lines) are relatively linear, while the convergence points (dots) show a slight curvature.
* The convergence points for Books and Wikipedia are close to each other, suggesting similar performance at convergence.
### Interpretation
The left chart demonstrates the scaling behavior of language models with varying dataset sizes. The consistent lower loss of WebText2 suggests that this dataset is more effective for training, potentially due to its quality or diversity. The diminishing returns of increasing parameters indicate a point of saturation where adding more parameters yields less significant improvements in performance.
The right chart illustrates the concept of generalization. The negative correlation between loss on the training distribution and loss on another distribution suggests that models performing well on the training data also tend to generalize better to unseen data. The convergence points indicate that both Books and Wikipedia datasets can achieve comparable performance when trained to convergence. The difference between the training curves and convergence points highlights the impact of training on model generalization. The fact that the convergence points are not perfectly aligned suggests that the datasets have different characteristics that affect their generalization performance.