## Scatter Plot: Model Performance on Olympiad Math Problems vs. Model Size
### Overview
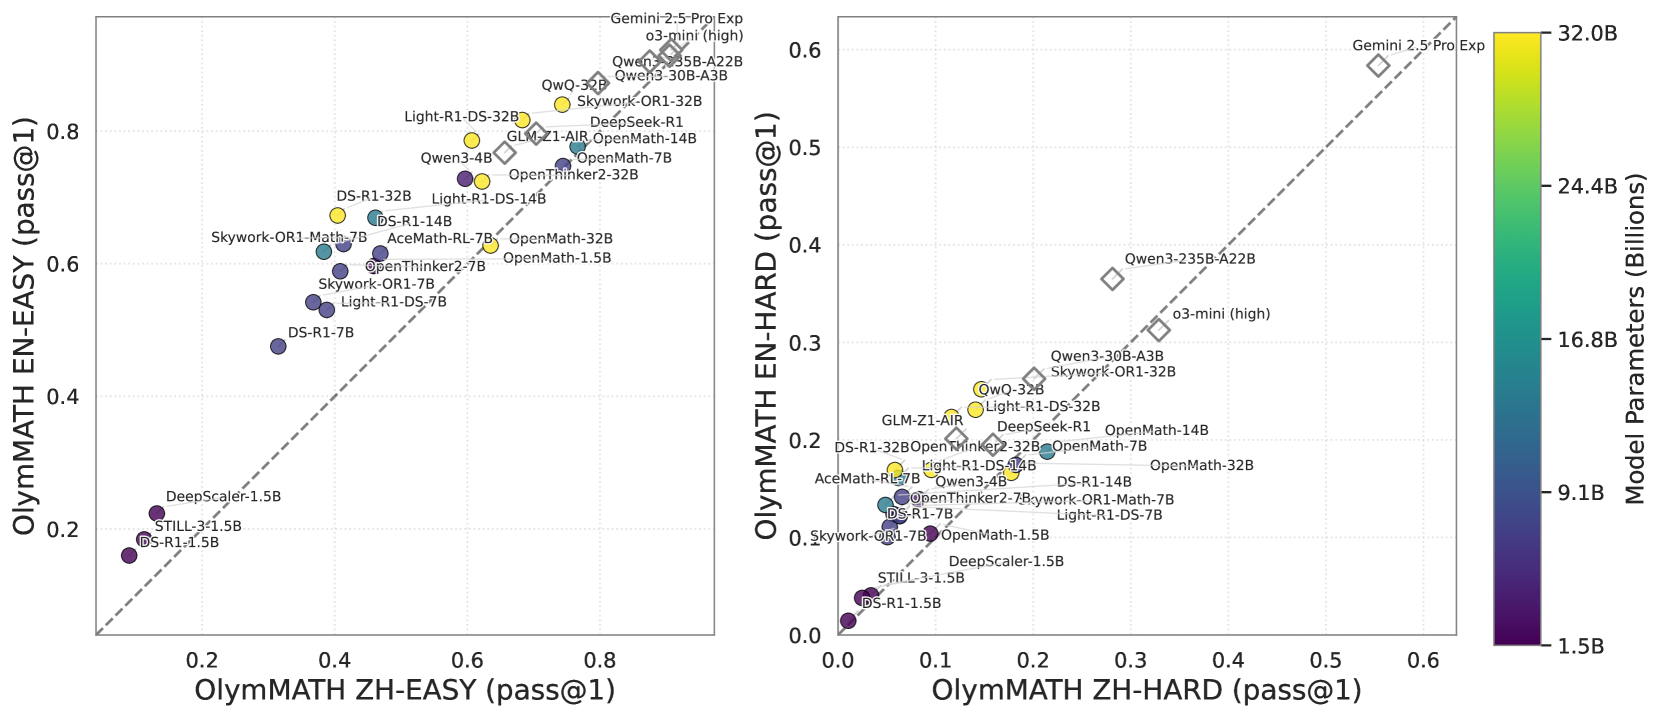
This image presents two scatter plots comparing the performance of various language models on two Olympiad Math benchmarks (EN-EASY and EN-HARD) against the number of model parameters. A color gradient represents the model size, ranging from 1.5B to 32.0B parameters. Each point represents a specific model, labeled with its name. The plots are positioned side-by-side, with the EN-EASY plot on the left and the EN-HARD plot on the right. A vertical colorbar on the right indicates the mapping between color and model size.
### Components/Axes
* **X-axis (Left Plot):** OlyMath ZH-EASY (pass@1) - Scale ranges from approximately 0.0 to 0.8.
* **Y-axis (Left Plot):** OlyMath EN-EASY (pass@1) - Scale ranges from approximately 0.0 to 0.8.
* **X-axis (Right Plot):** OlyMath ZH-HARD (pass@1) - Scale ranges from approximately 0.0 to 0.7.
* **Y-axis (Right Plot):** OlyMath EN-HARD (pass@1) - Scale ranges from approximately 0.0 to 0.5.
* **Colorbar:** Model Parameters (Billions) - Scale ranges from 1.5B (purple) to 32.0B (yellow).
* **Legend:** No explicit legend, but model names are directly labeled on the scatter plot.
* **Data Points:** Each point represents a model, with color indicating model size.
* **Lines:** Two dashed lines are present on the right plot, representing Gemini 2.5 Pro Exp and Gemini 2.5 Pro.
### Detailed Analysis or Content Details
**Left Plot (EN-EASY):**
* **Trend:** A general upward trend is visible, indicating that larger models tend to perform better on the EN-EASY benchmark. The points are somewhat scattered, suggesting variability in performance for models of similar size.
* **Data Points (Approximate):**
* DS-R1-7B: (0.28, 0.48) - Purple
* DeepScaler-1.5B: (0.24, 0.36) - Purple
* STILL-31.5B: (0.32, 0.44) - Yellow
* DS-R1-1.5B: (0.26, 0.40) - Purple
* Light-R1-DS-7B: (0.34, 0.50) - Green
* Skywork-OR1-Math7B: (0.36, 0.54) - Green
* Light-R1-DS-32B: (0.40, 0.60) - Yellow
* OpenMath-32B: (0.42, 0.62) - Yellow
* OpenThinker2-32B: (0.44, 0.64) - Yellow
* Owen3-4B: (0.46, 0.66) - Orange
* Owen3-30B-A3B: (0.48, 0.68) - Orange
* Owen3-235B-A22B: (0.50, 0.70) - Yellow
* GLM-Z1-AIR-OpenMath-14B: (0.38, 0.56) - Green
* AceMath-RL-7B: (0.30, 0.46) - Green
**Right Plot (EN-HARD):**
* **Trend:** Similar to the left plot, a general upward trend is observed. However, the points are more dispersed, indicating greater variability in performance on the EN-HARD benchmark.
* **Data Points (Approximate):**
* DS-R1-7B: (0.12, 0.18) - Purple
* DeepScaler-1.5B: (0.10, 0.14) - Purple
* STILL-31.5B: (0.18, 0.26) - Yellow
* DS-R1-1.5B: (0.11, 0.16) - Purple
* Light-R1-DS-7B: (0.16, 0.24) - Green
* Skywork-OR1-32B: (0.20, 0.30) - Yellow
* Light-R1-DS-32B: (0.22, 0.32) - Yellow
* OpenMath-32B: (0.24, 0.34) - Yellow
* OpenThinker2-32B: (0.26, 0.36) - Yellow
* Owen3-4B: (0.28, 0.38) - Orange
* Owen3-30B-A3B: (0.30, 0.40) - Orange
* Owen3-235B-A22B: (0.32, 0.42) - Yellow
* GLM-Z1-AIR-OpenMath-14B: (0.18, 0.26) - Green
* AceMath-RL-7B: (0.14, 0.20) - Green
* Gemini 2.5 Pro Exp: (0.5, 0.45) - Light Blue
* Gemini 2.5 Pro: (0.4, 0.35) - Light Blue
### Key Observations
* The Gemini 2.5 Pro models (both Exp and standard) significantly outperform other models on the EN-HARD benchmark, as indicated by their position far above the general trend.
* Model size appears to be a strong predictor of performance on both benchmarks, but the relationship is not perfectly linear.
* There is considerable overlap in performance between models of similar size, suggesting that factors other than model size (e.g., training data, architecture) also play a significant role.
* The EN-HARD benchmark appears to be more challenging than the EN-EASY benchmark, as evidenced by the lower overall performance scores.
### Interpretation
The data suggests a positive correlation between model size and performance on Olympiad Math problems. Larger models generally achieve higher pass rates on both the EN-EASY and EN-HARD benchmarks. However, the Gemini 2.5 Pro models represent a significant outlier, demonstrating substantially higher performance than other models, even those with comparable or larger parameter counts. This suggests that architectural innovations or training methodologies employed by Google have resulted in a model that is significantly more efficient at solving these types of problems.
The scatter plots provide a visual representation of the trade-off between model size and performance. While increasing model size generally leads to improved performance, there are diminishing returns, and other factors can significantly influence the outcome. The variability in performance among models of similar size highlights the importance of considering factors beyond just the number of parameters when evaluating language models. The difference in performance between the EN-EASY and EN-HARD benchmarks indicates that the difficulty of the task also plays a crucial role, with more challenging problems requiring more capable models.