## Scatter Plot: Music Genre Distribution Across Valid and Test Sets
### Overview
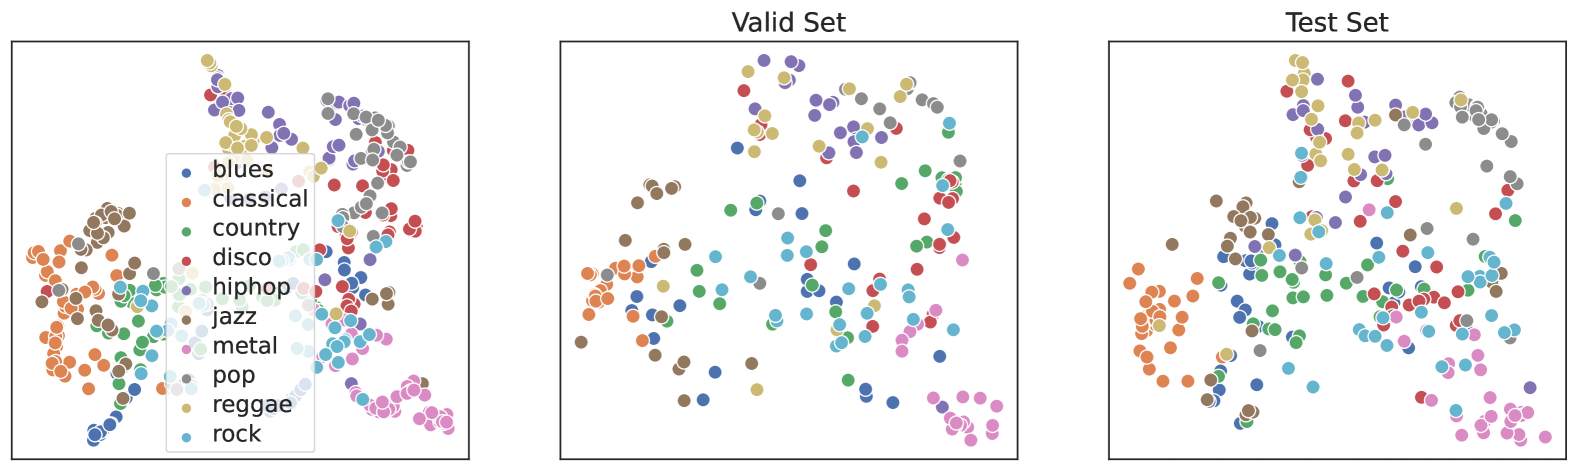
The image contains three scatter plots comparing the distribution of music genres across two datasets: a "Valid Set" and a "Test Set." Each plot uses colored dots to represent distinct genres, with a shared legend on the left. The third plot (unlabeled) appears to represent the original dataset before splitting.
### Components/Axes
- **Legend**: Located in the bottom-left corner of the main chart, mapping 10 genres to colors:
- blues (blue), classical (orange), country (green), disco (red), hiphop (purple), jazz (brown), metal (gray), pop (pink), reggae (yellow), rock (cyan).
- **Axes**:
- X-axis: "Feature 1" (no units specified).
- Y-axis: "Feature 2" (no units specified).
- **Plots**:
1. **Valid Set**: Centered title, data points clustered by genre.
2. **Test Set**: Centered title, similar clustering but with slight overlaps.
3. **Unlabeled Plot**: No title, identical genre distribution to the other two plots.
### Detailed Analysis
- **Genre Clusters**:
- **Blues**: Bottom-left quadrant (Valid/Test) and left-center (unlabeled).
- **Classical**: Top-left quadrant (Valid/Test) and left-center (unlabeled).
- **Country**: Scattered across mid-left (Valid/Test) and mid-left (unlabeled).
- **Disco**: Top-right quadrant (Valid/Test) and top-right (unlabeled).
- **Hiphop**: Top-center (Valid/Test) and top-center (unlabeled).
- **Jazz**: Mid-left (Valid/Test) and mid-left (unlabeled).
- **Metal**: Mid-right (Valid/Test) and mid-right (unlabeled).
- **Pop**: Bottom-right (Valid/Test) and bottom-right (unlabeled).
- **Reggae**: Top-right (Valid/Test) and top-right (unlabeled).
- **Rock**: Bottom-right (Valid/Test) and bottom-right (unlabeled).
- **Data Point Density**:
- Each genre has ~10–15 data points per plot, with minimal overlap between clusters.
- **Test Set** shows slightly more overlap (e.g., rock and pop in bottom-right) compared to the **Valid Set**.
### Key Observations
1. **Cluster Separation**: Genres are mostly distinct in the **Valid Set**, suggesting effective data separation.
2. **Overlap in Test Set**: Minor overlaps (e.g., rock/pop, disco/hiphop) indicate potential ambiguity in test data.
3. **Consistency Across Plots**: The unlabeled plot mirrors the Valid/Test distributions, implying it represents the original dataset.
### Interpretation
The scatter plots demonstrate that the model can effectively distinguish between music genres in the **Valid Set**, as clusters are well-separated. However, the **Test Set** shows slight overlaps, suggesting the model may struggle with ambiguous cases (e.g., rock vs. pop). The unlabeled plot confirms the original data’s structure, validating the splitting process. This visualization highlights the importance of dataset quality and genre-specific feature engineering for accurate classification.