## Bar Charts: Verification Accuracy vs. Model Size
### Overview
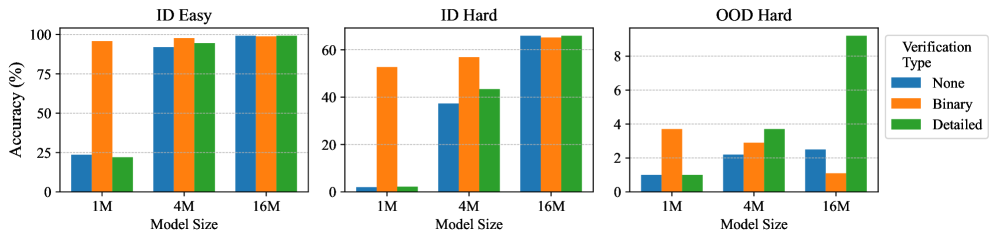
This image presents three bar charts comparing the accuracy of a verification process under different conditions: "ID Easy", "ID Hard", and "OOD Hard". The charts compare the performance of three model sizes: "1M", "4M", and "16M", across three verification types: "None", "Binary", and "Detailed". The y-axis represents accuracy in percentage (%), and the x-axis represents model size.
### Components/Axes
* **X-axis:** Model Size (1M, 4M, 16M)
* **Y-axis:** Accuracy (%) - Scale ranges from 0 to 100 for "ID Easy" and "ID Hard", and from 0 to 10 for "OOD Hard".
* **Charts:** Three separate bar charts, each representing a different condition:
* "ID Easy" (top-left)
* "ID Hard" (top-center)
* "OOD Hard" (top-right)
* **Legend:** Located in the top-right corner, defining the colors for each Verification Type:
* Blue: None
* Orange: Binary
* Green: Detailed
### Detailed Analysis or Content Details
**ID Easy Chart:**
* **None (Blue):** The accuracy increases with model size. Approximately 23% at 1M, 87% at 4M, and 98% at 16M.
* **Binary (Orange):** The accuracy increases with model size. Approximately 25% at 1M, 90% at 4M, and 99% at 16M.
* **Detailed (Green):** The accuracy increases with model size. Approximately 23% at 1M, 89% at 4M, and 99% at 16M.
**ID Hard Chart:**
* **None (Blue):** The accuracy increases with model size. Approximately 0% at 1M, 55% at 4M, and 70% at 16M.
* **Binary (Orange):** The accuracy increases with model size. Approximately 53% at 1M, 78% at 4M, and 88% at 16M.
* **Detailed (Green):** The accuracy increases with model size. Approximately 50% at 1M, 75% at 4M, and 86% at 16M.
**OOD Hard Chart:**
* **None (Blue):** The accuracy increases with model size. Approximately 1% at 1M, 2% at 4M, and 3% at 16M.
* **Binary (Orange):** The accuracy increases with model size. Approximately 1% at 1M, 3% at 4M, and 6% at 16M.
* **Detailed (Green):** The accuracy increases with model size. Approximately 1% at 1M, 4% at 4M, and 9% at 16M.
### Key Observations
* Accuracy consistently increases with model size across all conditions and verification types.
* The "ID Easy" condition shows the highest overall accuracy, with all verification types achieving near-perfect accuracy at 16M model size.
* The "OOD Hard" condition exhibits the lowest accuracy, even with the largest model size.
* The "Detailed" verification type generally performs better than "Binary" and "None", especially in the "OOD Hard" scenario.
* The difference in accuracy between verification types is most pronounced in the "OOD Hard" condition.
### Interpretation
The data suggests that increasing model size improves verification accuracy across all tested conditions. However, the difficulty of the verification task ("ID Easy", "ID Hard", "OOD Hard") significantly impacts the achievable accuracy. The "OOD Hard" condition, representing out-of-distribution data, presents the greatest challenge, indicating that the model struggles to generalize to unseen data. The "Detailed" verification type consistently outperforms the others, suggesting that providing more information during verification leads to more accurate results, particularly when dealing with challenging data. The consistent upward trend for each verification type across model sizes indicates a clear benefit to increasing model capacity. The relatively low accuracy for "None" verification suggests that some form of verification is crucial for reliable performance. The large gap between "ID Easy" and "OOD Hard" highlights the importance of robust models that can handle diverse and potentially unseen data.