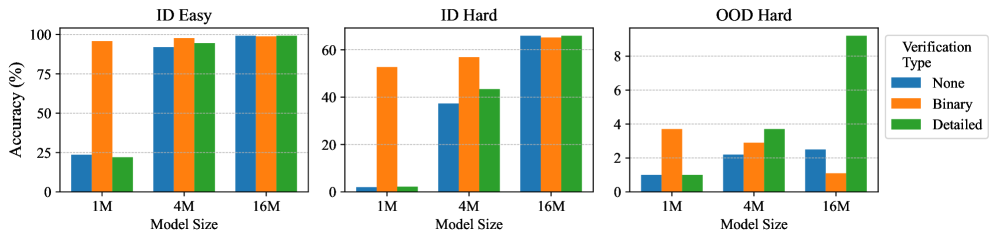
## Grouped Bar Chart: Model Accuracy by Size and Verification Type
### Overview
The image displays three grouped bar charts arranged horizontally, comparing the accuracy (%) of machine learning models across three different evaluation settings ("ID Easy", "ID Hard", "OOD Hard") and three model sizes (1M, 4M, 16M). Performance is further broken down by three "Verification Types": None, Binary, and Detailed.
### Components/Axes
* **Chart Type:** Grouped Bar Chart (3 subplots).
* **Subplot Titles (Top Center):**
* Left: `ID Easy`
* Center: `ID Hard`
* Right: `OOD Hard`
* **Y-Axis (Leftmost chart only, shared scale concept):**
* **Label:** `Accuracy (%)`
* **Scale:** 0 to 100, with major ticks at 0, 25, 50, 75, 100.
* **X-Axis (Each subplot):**
* **Label:** `Model Size`
* **Categories:** `1M`, `4M`, `16M`.
* **Legend (Position: Far right, outside the "OOD Hard" chart):**
* **Title:** `Verification Type`
* **Categories & Colors:**
* `None` - Blue
* `Binary` - Orange
* `Detailed` - Green
### Detailed Analysis
**1. ID Easy (Left Subplot)**
* **Trend:** All verification types show high accuracy, with a slight upward trend as model size increases. Binary verification is consistently the highest.
* **Data Points (Approximate %):**
* **1M Model:** None ≈ 25%, Binary ≈ 95%, Detailed ≈ 25%.
* **4M Model:** None ≈ 90%, Binary ≈ 98%, Detailed ≈ 95%.
* **16M Model:** None ≈ 98%, Binary ≈ 99%, Detailed ≈ 98%.
**2. ID Hard (Center Subplot)**
* **Trend:** Clear positive correlation between model size and accuracy for all verification types. Binary verification maintains a lead, but the gap narrows at larger sizes.
* **Data Points (Approximate %):**
* **1M Model:** None ≈ 2%, Binary ≈ 52%, Detailed ≈ 2%.
* **4M Model:** None ≈ 38%, Binary ≈ 58%, Detailed ≈ 42%.
* **16M Model:** None ≈ 65%, Binary ≈ 65%, Detailed ≈ 65%.
**3. OOD Hard (Right Subplot)**
* **Trend:** Overall accuracy is drastically lower than in-distribution (ID) tasks. The trend is less uniform. Notably, Detailed verification shows a dramatic, disproportionate increase for the largest model.
* **Data Points (Approximate %):**
* **1M Model:** None ≈ 1%, Binary ≈ 3.8%, Detailed ≈ 1%.
* **4M Model:** None ≈ 2.2%, Binary ≈ 3%, Detailed ≈ 3.8%.
* **16M Model:** None ≈ 2.5%, Binary ≈ 1.2%, Detailed ≈ 9%.
### Key Observations
1. **Performance Hierarchy:** In easier tasks (ID Easy), Binary verification is superior. In harder tasks (ID Hard, OOD Hard), the advantage diminishes or changes.
2. **Model Scaling Benefit:** Increasing model size from 1M to 16M parameters consistently improves accuracy across all settings and verification types, though the absolute gain is smallest in OOD Hard (except for Detailed verification).
3. **Verification Type Impact:** The effect of verification is highly context-dependent. It provides a massive boost in "ID Easy" for the 1M model but has minimal or even negative impact in "OOD Hard" for some sizes.
4. **Critical Outlier:** The performance of **Detailed verification on the 16M model in the OOD Hard setting** is a major outlier. It jumps to ~9% accuracy, while all other data points in that chart are below 4%. This suggests a potential breakthrough or specific synergy for large models using detailed verification on out-of-distribution tasks.
5. **Task Difficulty Gradient:** There is a stark drop in baseline accuracy (None verification) from ID Easy (~25-98%) to ID Hard (~2-65%) to OOD Hard (~1-2.5%), clearly illustrating the increasing difficulty of these evaluation settings.
### Interpretation
This data suggests several important insights for model development and evaluation:
* **Verification is Not Universally Beneficial:** The "Binary" verification method acts as a strong performance crutch for smaller models on easier tasks but does not scale its advantage to harder problems or larger models. Its utility is context-specific.
* **The Promise of Detailed Verification:** While often underperforming on easier tasks, **Detailed verification shows unique potential for large models (16M) on the hardest, out-of-distribution tasks**. This could indicate that detailed reasoning or verification steps become crucial when a model has sufficient capacity to leverage them in unfamiliar scenarios.
* **Scaling Laws Hold, But Are Task-Dependent:** The consistent improvement with model size confirms scaling laws, but the *rate* of improvement varies dramatically. Gains are massive in ID settings but marginal in OOD settings, highlighting a fundamental challenge in generalization.
* **OOD Generalization Remains the Core Challenge:** The extremely low accuracy across the board in "OOD Hard" (all values <10%) underscores that current methods, even with large models and verification, struggle significantly with distribution shift. The spike for Detailed/16M is a promising but isolated data point that requires further investigation.
In summary, the charts argue for a nuanced approach: simple verification may suffice for known domains, but advancing to truly out-of-distribution problems may require both large model scale and more sophisticated, detailed verification mechanisms.