## Diagram: Arrow Configuration Transformations
### Overview
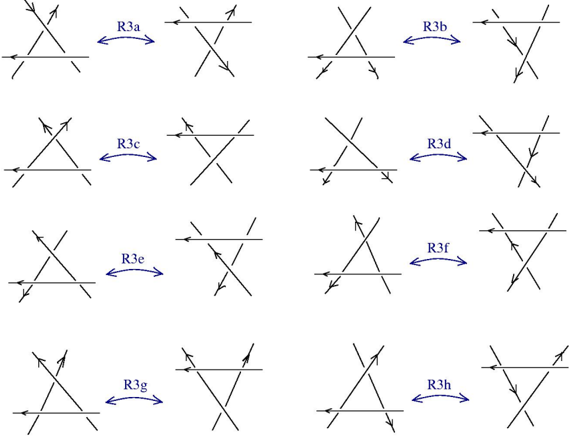
The image displays a grid of eight diagrams (2x4 layout) illustrating transformations between arrow configurations. Each diagram is labeled with a unique identifier (e.g., R3a, R3b) and shows directional arrows intersecting or diverging. Arrows are depicted with directional indicators (→, ←, ↑, ↓) and spatial relationships (e.g., crossing, parallel, opposing).
### Components/Axes
- **Labels**:
- R3a, R3b, R3c, R3d, R3e, R3f, R3g, R3h (eight distinct configurations).
- **Arrow Directions**:
- Arrows are annotated with directional symbols (→, ←, ↑, ↓) to indicate flow or orientation.
- **Spatial Relationships**:
- Arrows intersect, diverge, or align in specific patterns (e.g., crossing, parallel, opposing).
### Detailed Analysis
1. **R3a**: Two arrows cross diagonally (↗ and ↖), with a horizontal line below.
2. **R3b**: Two arrows point in opposite horizontal directions (→ and ←), with a horizontal line above.
3. **R3c**: Two arrows form a V-shape (↗ and ↙), with a horizontal line below.
4. **R3d**: Two arrows cross diagonally (↘ and ↖), with a horizontal line above.
5. **R3e**: Two arrows form an X-shape (↗ and ↙), with a horizontal line below.
6. **R3f**: Two arrows cross diagonally (↘ and ↖), with a horizontal line below.
7. **R3g**: Two arrows form a V-shape (↗ and ↙), with a horizontal line above.
8. **R3h**: Two arrows cross diagonally (↘ and ↖), with a horizontal line below.
### Key Observations
- **Directional Variability**: Arrows alternate between horizontal, diagonal, and V-shaped configurations.
- **Label Consistency**: All labels follow the "R3X" format (X = a–h), suggesting a systematic categorization.
- **Spatial Patterns**: Horizontal lines appear in all diagrams, either above or below the arrow intersections.
### Interpretation
The diagrams likely represent states or steps in a process where directional relationships (e.g., alignment, opposition) between variables or components are critical. The horizontal line may symbolize a baseline or reference point. The systematic labeling (R3a–R3h) implies a structured framework for analyzing transformations, possibly in fields like physics, engineering, or systems theory. No numerical data is present, so trends or outliers cannot be quantified.