## Multi-Line Chart: Model Performance Across Three Evaluation Benchmarks
### Overview
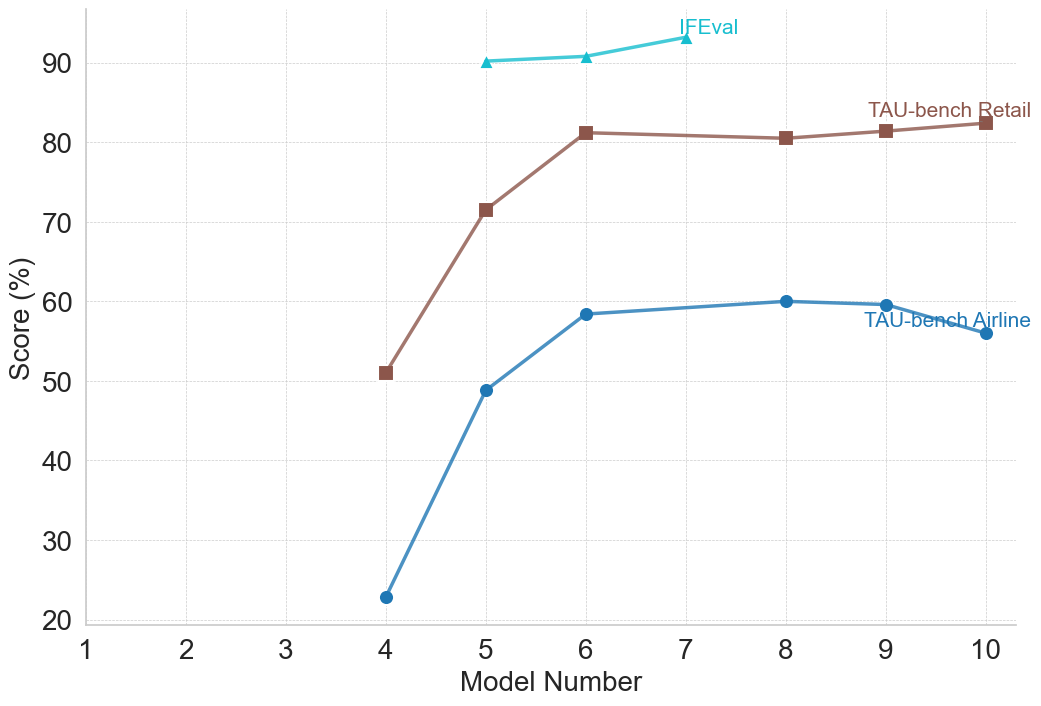
The image displays a line chart comparing the performance scores (in percentage) of three different evaluation benchmarks across a series of model numbers. The chart tracks how scores change as the model number increases from 4 to 10.
### Components/Axes
* **Chart Type:** Multi-line chart with markers.
* **X-Axis:**
* **Label:** "Model Number"
* **Scale:** Linear, from 1 to 10. Data points are plotted for model numbers 4, 5, 6, 7, 8, 9, and 10.
* **Y-Axis:**
* **Label:** "Score (%)"
* **Scale:** Linear, from 20 to 90, with major gridlines at intervals of 10.
* **Data Series & Legend:** The legend is embedded directly into the chart area, with labels placed adjacent to their respective lines.
1. **Series 1:** Label: "IFEval". Visual: Cyan line with upward-pointing triangle markers.
2. **Series 2:** Label: "TAU-bench Retail". Visual: Brown line with square markers.
3. **Series 3:** Label: "TAU-bench Airline". Visual: Blue line with circle markers.
* **Grid:** A light gray, dashed grid is present for both horizontal and vertical axes.
### Detailed Analysis
**Data Series 1: IFEval (Cyan, Triangles)**
* **Trend:** Shows a very slight, steady upward trend across the observed model numbers.
* **Data Points (Approximate):**
* Model 4: ~90%
* Model 5: ~90.5%
* Model 6: ~91%
* Model 7: ~93%
* (Data points for models 8, 9, 10 are not plotted for this series).
**Data Series 2: TAU-bench Retail (Brown, Squares)**
* **Trend:** Shows a sharp increase from model 4 to 6, followed by a plateau with very minor fluctuations.
* **Data Points (Approximate):**
* Model 4: ~51%
* Model 5: ~71%
* Model 6: ~81%
* Model 7: ~81%
* Model 8: ~80.5%
* Model 9: ~81.5%
* Model 10: ~82%
**Data Series 3: TAU-bench Airline (Blue, Circles)**
* **Trend:** Shows a steep increase from model 4 to 6, a slower rise to a peak at model 8, followed by a slight decline.
* **Data Points (Approximate):**
* Model 4: ~23%
* Model 5: ~49%
* Model 6: ~58%
* Model 7: ~59%
* Model 8: ~60%
* Model 9: ~59.5%
* Model 10: ~56%
### Key Observations
1. **Performance Hierarchy:** IFEval consistently yields the highest scores (above 90%), followed by TAU-bench Retail (peaking around 82%), with TAU-bench Airline showing the lowest scores (peaking at 60%).
2. **Greatest Improvement:** The most significant performance jumps for the TAU-bench series occur between models 4 and 6.
3. **Diverging Late-Stage Trends:** After model 8, the TAU-bench Retail score remains stable, while the TAU-bench Airline score shows a noticeable decline.
4. **Data Coverage:** The IFEval series only provides data for models 4 through 7, while the two TAU-bench series cover the full range from 4 to 10.
### Interpretation
The chart suggests that the evaluated models undergo significant capability improvements between iterations 4 and 6, as reflected in sharp score increases on the TAU-bench Retail and Airline tasks. The IFEval benchmark, which starts at a very high baseline, shows only marginal gains, indicating it may be measuring a different, more stable capability or that the models are already near its performance ceiling.
The divergence after model 8 is particularly noteworthy. The stability of the Retail score versus the decline in the Airline score could indicate that later model optimizations (from 8 to 10) may have specialized or overfitted the models for certain types of tasks (like retail) at the slight expense of others (like airline-related tasks), or that the Airline benchmark is more sensitive to specific changes in the model architecture or training data. The absence of IFEval data for later models prevents a complete cross-benchmark comparison in that range. Overall, the data demonstrates that model progression does not uniformly improve performance across all evaluation domains.