## Bar Chart: Rouge-L Scores Across Datasets for CogGRAG Variants
### Overview
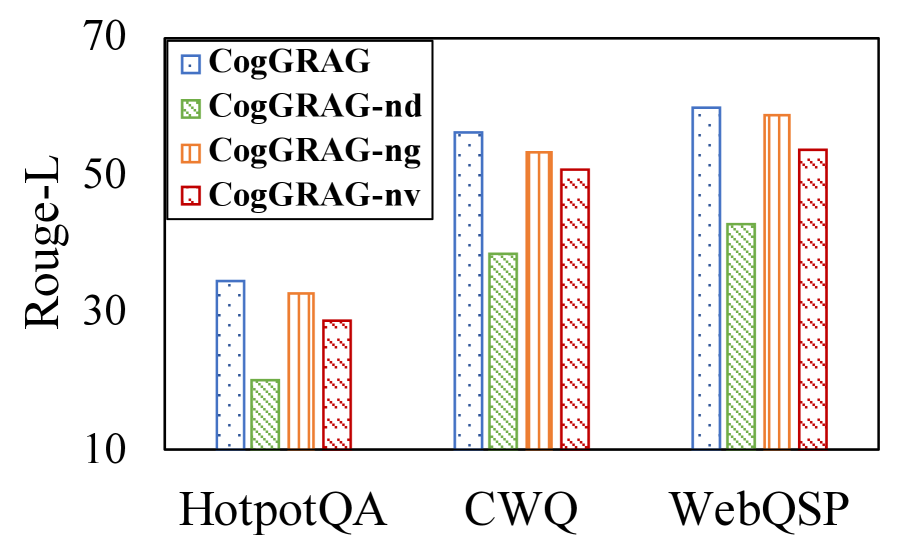
The chart compares Rouge-L scores of four CogGRAG model variants (CogGRAG, CogGRAG-nd, CogGRAG-ng, CogGRAG-nv) across three question-answering datasets: HotpotQA, CWQ, and WebQSP. The y-axis represents Rouge-L scores (10–70), while the x-axis categorizes datasets. Each variant is visually distinct via color and pattern.
### Components/Axes
- **X-axis (Datasets)**:
- HotpotQA (leftmost)
- CWQ (middle)
- WebQSP (rightmost)
- **Y-axis (Rouge-L Scores)**:
- Scale: 10, 30, 50, 70 (linear)
- **Legend (Top-left)**:
- **CogGRAG**: Blue dotted bars
- **CogGRAG-nd**: Green striped bars
- **CogGRAG-ng**: Orange striped bars
- **CogGRAG-nv**: Red striped bars
### Detailed Analysis
1. **HotpotQA**:
- CogGRAG: ~32 (blue dotted)
- CogGRAG-nd: ~22 (green striped)
- CogGRAG-ng: ~31 (orange striped)
- CogGRAG-nv: ~29 (red striped)
2. **CWQ**:
- CogGRAG: ~55 (blue dotted)
- CogGRAG-nd: ~40 (green striped)
- CogGRAG-ng: ~52 (orange striped)
- CogGRAG-nv: ~50 (red striped)
3. **WebQSP**:
- CogGRAG: ~60 (blue dotted)
- CogGRAG-nd: ~45 (green striped)
- CogGRAG-ng: ~58 (orange striped)
- CogGRAG-nv: ~53 (red striped)
### Key Observations
- **Consistent Performance**: CogGRAG (blue dotted) outperforms all variants in every dataset.
- **Dataset Variance**: WebQSP shows the highest scores overall, while HotpotQA has the lowest.
- **Component Impact**: Removing components (nd, ng, nv) reduces scores, with CogGRAG-nd (green striped) consistently lowest.
- **Trend**: Scores increase from HotpotQA to WebQSP for CogGRAG, suggesting dataset complexity correlates with performance.
### Interpretation
The data demonstrates that the base CogGRAG model achieves the highest Rouge-L scores, indicating its effectiveness in question-answering tasks. The removal of specific components (e.g., "nd," "ng," "nv") degrades performance, suggesting these elements are critical to the model's success. WebQSP's higher scores may reflect its alignment with the model's training data or task complexity. The consistent underperformance of CogGRAG-nd highlights the importance of the "nd" component in maintaining model accuracy. This analysis underscores the need for careful component selection in model design to optimize performance across diverse datasets.