\n
## Charts: Model Performance vs. Decoded Path Number
### Overview
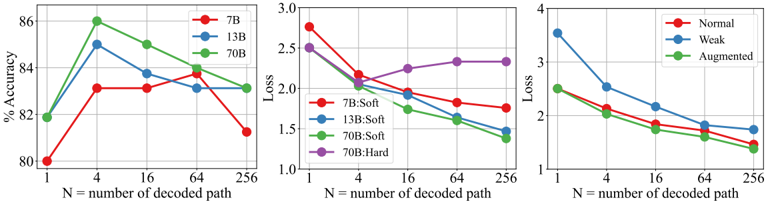
The image presents three charts comparing the performance of different model sizes (7B, 13B, 70B) and data augmentation techniques (Normal, Weak, Augmented) as the number of decoded paths (N) increases. The first chart shows accuracy, the second loss for soft decoding, and the third loss for hard decoding.
### Components/Axes
All three charts share the same x-axis: "N = number of decoded path", ranging from 1 to 256. The y-axis scales differ for each chart.
* **Chart 1 (Accuracy):** Y-axis is "% Accuracy", ranging from 80% to 86%.
* Legend:
* Red: 7B
* Blue: 13B
* Green: 70B
* **Chart 2 (Loss - Soft Decoding):** Y-axis is "Loss", ranging from 1.0 to 3.0.
* Legend:
* Red: 7B:Soft
* Blue: 13B:Soft
* Green: 70B:Soft
* Purple: 70B:Hard
* **Chart 3 (Loss - Hard Decoding):** Y-axis is "Loss", ranging from 1 to 4.
* Legend:
* Red: Normal
* Blue: Weak
* Green: Augmented
### Detailed Analysis or Content Details
**Chart 1 (Accuracy):**
* **7B (Red):** Starts at approximately 81% accuracy at N=1, increases sharply to around 84% at N=4, then declines steadily to approximately 82% at N=256.
* **13B (Blue):** Starts at approximately 82% accuracy at N=1, increases to a peak of around 85% at N=4, then decreases to approximately 83% at N=256.
* **70B (Green):** Starts at approximately 83% accuracy at N=1, increases to a peak of around 86% at N=4, then declines to approximately 83% at N=256.
**Chart 2 (Loss - Soft Decoding):**
* **7B:Soft (Red):** Starts at approximately 2.8 loss at N=1, decreases to around 1.8 loss at N=4, then fluctuates between 1.8 and 2.1 loss, ending at approximately 1.8 loss at N=256.
* **13B:Soft (Blue):** Starts at approximately 2.6 loss at N=1, decreases to around 1.7 loss at N=4, then fluctuates between 1.7 and 2.0 loss, ending at approximately 1.9 loss at N=256.
* **70B:Soft (Green):** Starts at approximately 2.5 loss at N=1, decreases to around 1.5 loss at N=4, then fluctuates between 1.5 and 1.8 loss, ending at approximately 1.6 loss at N=256.
* **70B:Hard (Purple):** Starts at approximately 2.7 loss at N=1, decreases to around 2.2 loss at N=4, then increases to approximately 2.4 loss at N=16, and fluctuates between 2.3 and 2.5 loss, ending at approximately 2.4 loss at N=256.
**Chart 3 (Loss - Hard Decoding):**
* **Normal (Red):** Starts at approximately 3.5 loss at N=1, decreases to around 2.2 loss at N=4, then decreases to approximately 1.8 loss at N=256.
* **Weak (Blue):** Starts at approximately 3.8 loss at N=1, decreases to around 2.5 loss at N=4, then decreases to approximately 2.0 loss at N=256.
* **Augmented (Green):** Starts at approximately 4.0 loss at N=1, decreases sharply to around 2.0 loss at N=4, then decreases to approximately 1.6 loss at N=256.
### Key Observations
* All models show an initial increase in accuracy (Chart 1) and a decrease in loss (Charts 2 & 3) as the number of decoded paths increases from 1 to 4.
* Beyond N=4, accuracy plateaus or declines slightly for all models (Chart 1).
* The 70B model consistently achieves the highest accuracy (Chart 1) and lowest loss (Charts 2 & 3) across most values of N.
* In Chart 3, the Augmented data consistently results in the lowest loss values, indicating the most effective performance.
* The 70B:Hard decoding method (Chart 2) shows a slight increase in loss after N=4, while the soft decoding methods continue to decrease.
### Interpretation
These charts demonstrate the impact of model size and data augmentation on the performance of a decoding process. Increasing the number of decoded paths initially improves performance (up to N=4), likely by allowing the model to explore more potential solutions. However, beyond this point, the benefits diminish, and performance may even degrade.
The superior performance of the 70B model suggests that larger models have a greater capacity to learn and generalize from the data. The effectiveness of data augmentation (Chart 3) indicates that increasing the diversity of the training data can improve the model's robustness and accuracy. The difference between soft and hard decoding (Chart 2) suggests that soft decoding provides a more stable and consistent performance, while hard decoding can be more sensitive to the number of decoded paths. The slight increase in loss for 70B:Hard after N=4 could indicate overfitting or instability in the decoding process for larger models when using hard decoding. The charts collectively suggest a trade-off between model size, decoding strategy, and data augmentation in optimizing performance.