TECHNICAL ASSET FINGERPRINT
f0279c7ad08d929939da14b1
Click to view fullscreen
Press ESC or click to close
FOUND IN PAPERS
EXPERT: healer-alpha-free VERSION 1
RUNTIME: free/openrouter/healer-alpha
INTEL_VERIFIED
\n
## Multi-Panel Line Chart Series: Performance Metrics vs. Decoded Paths
### Overview
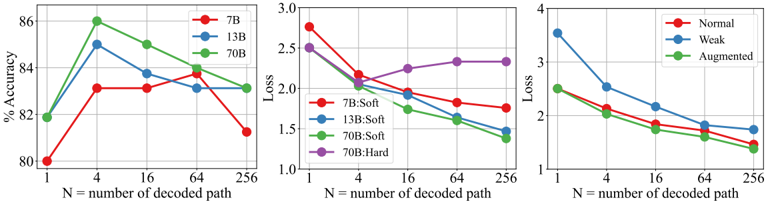
The image contains three separate line charts arranged horizontally. Each chart plots a different performance metric (Accuracy, Loss, and another Loss metric) against the same independent variable: the number of decoded paths (`N`). The charts compare different model sizes (7B, 13B, 70B) and training conditions (Soft, Hard, Normal, Weak, Augmented). The overall purpose is to visualize how model performance scales with increased decoding paths under various configurations.
### Components/Axes
**Common Elements:**
* **X-Axis (All Charts):** Labeled `N = number of decoded path`. The scale is logarithmic, with major tick marks at 1, 4, 16, 64, and 256.
* **Legend Position:** All legends are located in the top-right corner of their respective chart panels.
**Chart 1 (Left): Accuracy**
* **Y-Axis:** Labeled `% Accuracy`. Scale ranges from 80 to 86, with major ticks at 80, 82, 84, 86.
* **Legend:**
* Red line with circle markers: `7B`
* Blue line with circle markers: `13B`
* Green line with circle markers: `70B`
**Chart 2 (Center): Loss (Model Size & Training Type)**
* **Y-Axis:** Labeled `Loss`. Scale ranges from 1.0 to 3.0, with major ticks at 1.0, 1.5, 2.0, 2.5, 3.0.
* **Legend:**
* Red line with circle markers: `7B:Soft`
* Blue line with circle markers: `13B:Soft`
* Green line with circle markers: `70B:Soft`
* Purple line with circle markers: `70B:Hard`
**Chart 3 (Right): Loss (Training Condition)**
* **Y-Axis:** Labeled `Loss`. Scale ranges from 1 to 4, with major ticks at 1, 2, 3, 4.
* **Legend:**
* Red line with circle markers: `Normal`
* Blue line with circle markers: `Weak`
* Green line with circle markers: `Augmented`
### Detailed Analysis
**Chart 1: Accuracy vs. N**
* **7B (Red Line):** Starts at ~80.0% (N=1). Increases to a peak of ~83.2% at N=4. Plateaus around 83.2% for N=16 and N=64. Decreases to ~81.2% at N=256.
* **13B (Blue Line):** Starts at ~81.8% (N=1). Sharp increase to a peak of ~85.0% at N=4. Decreases to ~83.8% at N=16, then to ~83.2% at N=64. Slight increase to ~83.4% at N=256.
* **70B (Green Line):** Starts at ~81.8% (N=1). Sharp increase to the highest peak on the chart, ~86.0%, at N=4. Decreases to ~85.0% at N=16, then to ~83.8% at N=64. Levels off at ~83.2% at N=256.
* **Trend Verification:** All three model sizes show an initial sharp improvement in accuracy from N=1 to N=4, followed by a general decline or plateau as N increases further. The 70B model achieves the highest peak accuracy.
**Chart 2: Loss vs. N (by Model & Training)**
* **7B:Soft (Red Line):** Starts highest at ~2.8 (N=1). Decreases steadily to ~2.1 (N=4), ~1.9 (N=16), ~1.8 (N=64), and ~1.75 (N=256).
* **13B:Soft (Blue Line):** Starts at ~2.5 (N=1). Decreases to ~2.0 (N=4), ~1.8 (N=16), ~1.6 (N=64), and ~1.5 (N=256).
* **70B:Soft (Green Line):** Starts at ~2.5 (N=1). Decreases to ~1.9 (N=4), ~1.7 (N=16), ~1.5 (N=64), and ~1.35 (N=256). This line shows the steepest and most consistent decline.
* **70B:Hard (Purple Line):** Starts at ~2.5 (N=1). Decreases to ~2.1 (N=4), then increases slightly to ~2.25 (N=16), ~2.3 (N=64), and ~2.3 (N=256). This is the only line that shows an increasing trend after N=4.
* **Trend Verification:** For the "Soft" training condition, loss decreases consistently as N increases, with larger models (70B) achieving lower final loss. The "Hard" training condition for the 70B model shows a different pattern, with loss bottoming out at N=4 and then rising.
**Chart 3: Loss vs. N (by Training Condition)**
* **Normal (Red Line):** Starts at ~2.5 (N=1). Decreases to ~2.0 (N=4), ~1.8 (N=16), ~1.6 (N=64), and ~1.4 (N=256).
* **Weak (Blue Line):** Starts highest at ~3.5 (N=1). Decreases to ~2.5 (N=4), ~2.1 (N=16), ~1.8 (N=64), and ~1.7 (N=256). It remains the highest loss line throughout.
* **Augmented (Green Line):** Starts at ~2.5 (N=1). Decreases to ~2.0 (N=4), ~1.7 (N=16), ~1.5 (N=64), and ~1.35 (N=256). It closely tracks and ends slightly lower than the "Normal" line.
* **Trend Verification:** All three training conditions show a consistent downward trend in loss as N increases. The "Weak" condition starts with significantly higher loss but improves at a similar rate. The "Augmented" condition yields the lowest final loss.
### Key Observations
1. **Peak at N=4:** Accuracy for all models peaks at N=4 before declining. This suggests an optimal point for accuracy with a small number of decoded paths.
2. **Model Scaling Benefit:** In the Accuracy chart, the 70B model achieves the highest peak. In the Loss chart (Soft training), the 70B model achieves the lowest final loss, demonstrating clear benefits from scaling model size.
3. **Training Condition Impact:** The "Hard" training condition for the 70B model (Chart 2, purple line) results in a fundamentally different loss trajectory compared to "Soft" training, with loss increasing after N=4. The "Weak" condition (Chart 3, blue line) starts with much higher loss but follows a similar improvement curve.
4. **Diminishing Returns:** After N=4, increasing the number of decoded paths yields diminishing returns for accuracy and, in most cases, continues to reduce loss but at a slower rate.
### Interpretation
The data suggests a complex relationship between model scale, training methodology, decoding effort (`N`), and performance. The consistent peak in accuracy at N=4 across model sizes indicates that a small amount of decoding diversity significantly helps, but beyond that, additional paths may introduce noise or overfitting to the decoding process, harming accuracy. However, loss continues to decrease (or stabilize) with more paths for most configurations, suggesting the model's confidence or calibration improves even if final accuracy does not.
The stark difference between the `70B:Soft` and `70B:Hard` lines is particularly notable. It implies that the "Hard" training regime may make the model's loss landscape such that exploring more decoding paths (higher N) becomes detrimental, possibly due to overconfidence or a sharper optimum. The "Augmented" training condition appears most effective for minimizing loss in the long run.
From a practical standpoint, these charts argue for tuning the number of decoded paths (`N`) as a critical hyperparameter. The optimal `N` is not simply "more is better"; it depends on the model size, the training method, and whether the primary goal is maximizing accuracy or minimizing loss. For accuracy-focused tasks, a small `N` (like 4) may be optimal, while for tasks where model confidence (loss) is key, a larger `N` could be beneficial, depending on the training setup.
DECODING INTELLIGENCE...