## Bar Chart: Latency vs. Batch Size for FP16 and w8a8
### Overview
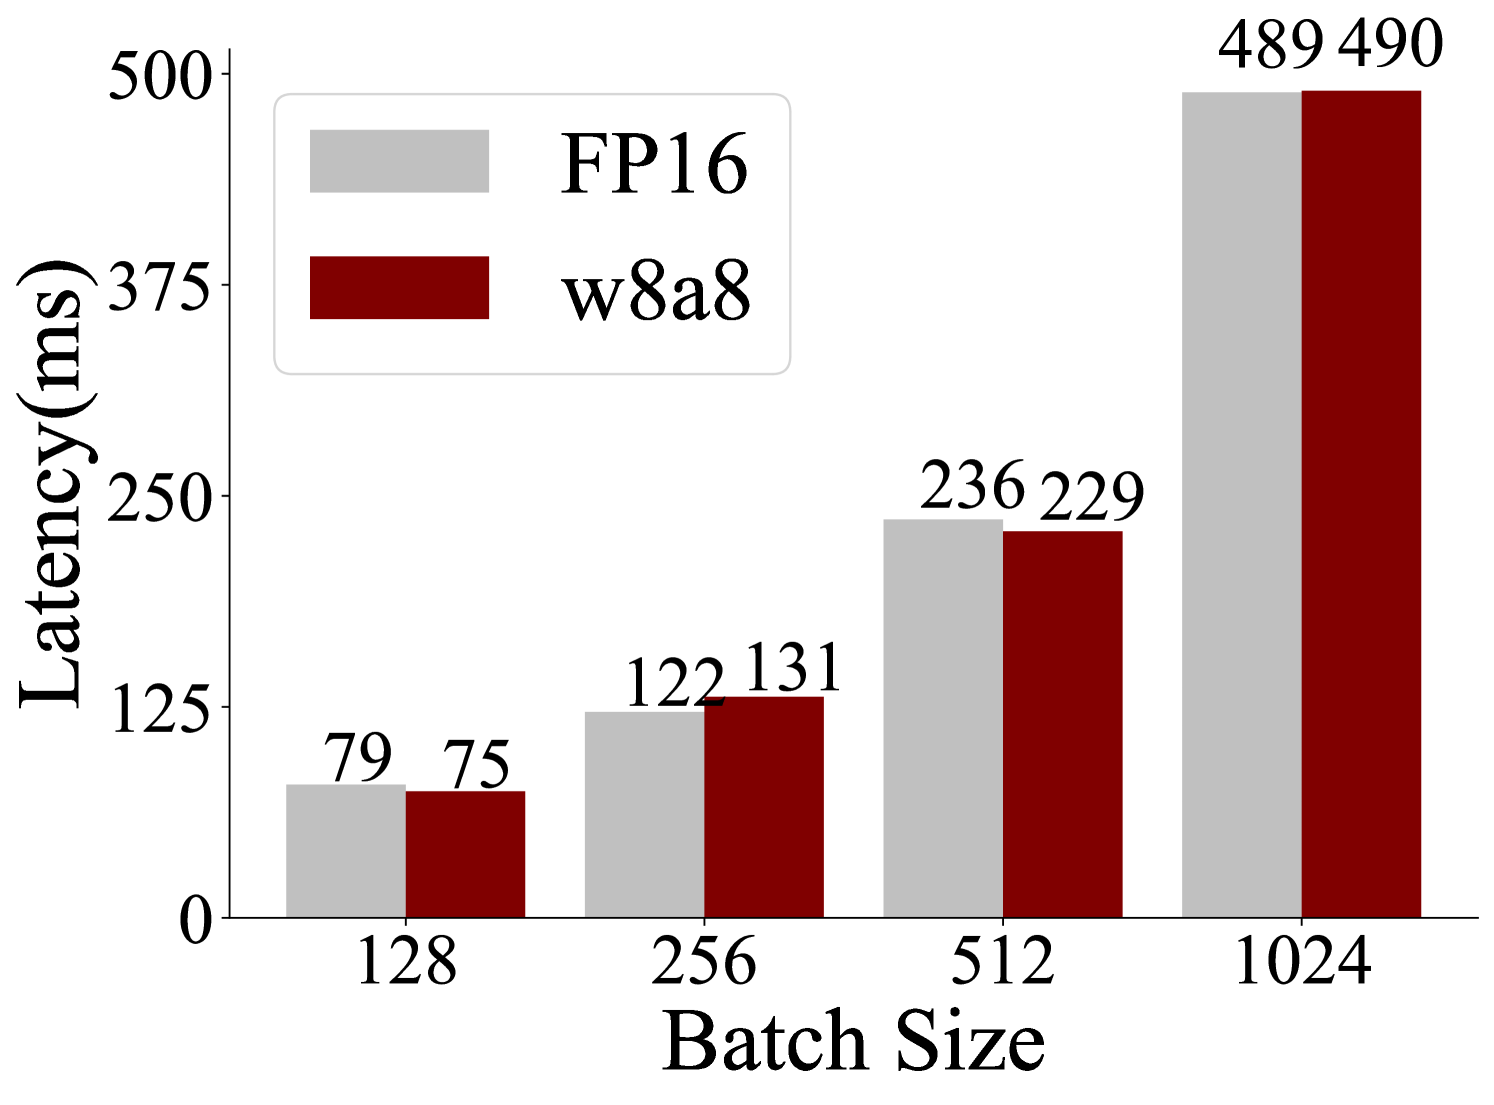
This image is a bar chart that compares the latency (in milliseconds) for two different data types, FP16 and w8a8, across various batch sizes. The chart displays four sets of paired bars, each representing a specific batch size: 128, 256, 512, and 1024. For each batch size, there are two bars: a light gray bar representing FP16 and a dark red bar representing w8a8. The height of each bar corresponds to the measured latency.
### Components/Axes
* **Y-axis Title**: "Latency(ms)"
* **Scale**: The y-axis ranges from 0 to 500, with major tick marks at 0, 125, 250, 375, and 500.
* **X-axis Title**: "Batch Size"
* **Categories**: The x-axis displays four batch sizes: 128, 256, 512, and 1024.
* **Legend**: Located in the top-left quadrant of the chart.
* **FP16**: Represented by a light gray rectangle.
* **w8a8**: Represented by a dark red rectangle.
### Detailed Analysis
The chart presents the following data points:
* **Batch Size 128**:
* FP16 (light gray bar): 79 ms
* w8a8 (dark red bar): 75 ms
* *Trend*: For batch size 128, w8a8 has a slightly lower latency than FP16.
* **Batch Size 256**:
* FP16 (light gray bar): 122 ms
* w8a8 (dark red bar): 131 ms
* *Trend*: For batch size 256, FP16 has a lower latency than w8a8.
* **Batch Size 512**:
* FP16 (light gray bar): 236 ms
* w8a8 (dark red bar): 229 ms
* *Trend*: For batch size 512, w8a8 has a slightly lower latency than FP16.
* **Batch Size 1024**:
* FP16 (light gray bar): 489 ms
* w8a8 (dark red bar): 490 ms
* *Trend*: For batch size 1024, FP16 has a slightly lower latency than w8a8.
### Key Observations
* **Overall Trend**: Latency increases significantly with increasing batch size for both FP16 and w8a8.
* **Comparison**:
* At batch sizes 128 and 512, w8a8 shows a slightly lower latency compared to FP16.
* At batch sizes 256 and 1024, FP16 shows a slightly lower latency compared to w8a8.
* **Magnitude of Difference**: The latency difference between FP16 and w8a8 is relatively small across all batch sizes, generally within a range of approximately 1-5 ms, except for batch size 256 where the difference is 9 ms.
* **Peak Latency**: The highest latencies are observed at the largest batch size (1024), with values close to 500 ms for both data types.
### Interpretation
This bar chart demonstrates the performance characteristics of FP16 and w8a8 data types in terms of latency as batch size varies. The data suggests that:
1. **Scalability**: Both FP16 and w8a8 exhibit a clear trend of increasing latency as the batch size grows. This is a common behavior in computational tasks, as larger batches require more processing power and memory, leading to longer execution times.
2. **Data Type Performance**: The comparison between FP16 and w8a8 reveals that their performance is quite similar across different batch sizes. There isn't a consistent winner; sometimes w8a8 is slightly faster, and at other times FP16 is. This suggests that for this particular task or hardware configuration, the choice between FP16 and w8a8 might not lead to a dramatic difference in latency, especially at smaller batch sizes. The slight variations could be attributed to factors like hardware optimization, memory access patterns, or specific algorithmic implementations.
3. **Batch Size Impact**: The most significant factor influencing latency is the batch size. The latency more than doubles when moving from batch size 128 to 256, and continues to increase substantially for larger batch sizes. This highlights the importance of selecting an appropriate batch size for optimal performance, balancing throughput with latency requirements.
4. **Near Equivalence at High Load**: At the highest batch size (1024), the latencies for FP16 and w8a8 are almost identical (489 ms vs. 490 ms). This could indicate that at such high loads, the system's resources are saturated, and both data types are experiencing similar bottlenecks, making their relative efficiency less distinguishable.
In essence, the chart provides empirical evidence for the latency behavior of these two data types under varying computational loads, indicating that while batch size is a dominant factor, the performance difference between FP16 and w8a8 is marginal and context-dependent.