## Diagram: Hypothesis-Observation Configurations
### Overview
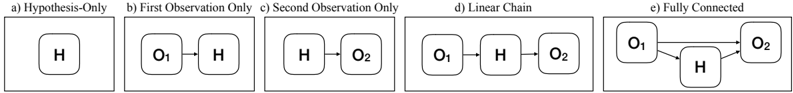
The image presents five distinct diagrams (a–e) illustrating different configurations of relationships between a central hypothesis node (H) and observation nodes (O₁, O₂). Each diagram represents a unique structural relationship, with directional arrows indicating dependencies or influences.
### Components/Axes
- **Nodes**:
- **H**: Central hypothesis node (appears in all diagrams).
- **O₁/O₂**: Observation nodes (appear in diagrams b–e).
- **Arrows**: Represent directional relationships (e.g., influence, dependency).
- **Labels**:
- Diagram titles (a–e) specify the configuration type.
- Node labels (H, O₁, O₂) are consistent across diagrams.
### Detailed Analysis
#### Diagram a) Hypothesis-Only
- **Structure**: Single node labeled **H**.
- **Interpretation**: Represents a hypothesis in isolation, with no observational data.
#### Diagram b) First Observation Only
- **Structure**: **O₁** → **H** (arrow from O₁ to H).
- **Interpretation**: Observational data (O₁) influences or informs the hypothesis (H).
#### Diagram c) Second Observation Only
- **Structure**: **H** → **O₂** (arrow from H to O₂).
- **Interpretation**: Hypothesis (H) predicts or generates observational data (O₂).
#### Diagram d) Linear Chain
- **Structure**: **O₁** → **H** → **O₂** (sequential dependency).
- **Interpretation**: Observational data (O₁) informs the hypothesis (H), which in turn predicts a second observation (O₂).
#### Diagram e) Fully Connected
- **Structure**: **O₁** ↔ **H** ↔ **O₂** (bidirectional arrows between all nodes).
- **Interpretation**: Hypothesis (H) and observations (O₁, O₂) mutually influence each other in a feedback loop.
### Key Observations
1. **Directionality**: Arrows in diagrams b–d indicate unidirectional influence, while diagram e shows bidirectional relationships.
2. **Node Presence**:
- H is present in all diagrams.
- O₁ appears in b, d, e; O₂ appears in c, d, e.
3. **Complexity**: Diagram e introduces the highest complexity with reciprocal relationships.
### Interpretation
The diagrams collectively model how hypotheses and observations interact in scientific or analytical frameworks:
- **Isolation (a)**: Hypothesis without empirical grounding.
- **Unidirectional Influence (b, c, d)**: Observations either inform hypotheses (b, d) or are predicted by them (c, d).
- **Feedback (e)**: Mutual reinforcement between hypothesis and observations, suggesting an iterative, self-correcting process.
This progression from isolation to interconnectedness highlights the importance of bidirectional validation in robust hypothesis testing. Diagram e’s fully connected structure implies a dynamic system where hypotheses and observations co-evolve, aligning with principles of Bayesian inference or systems theory.