## Bar Chart: Subarray Conflict Ratio
### Overview
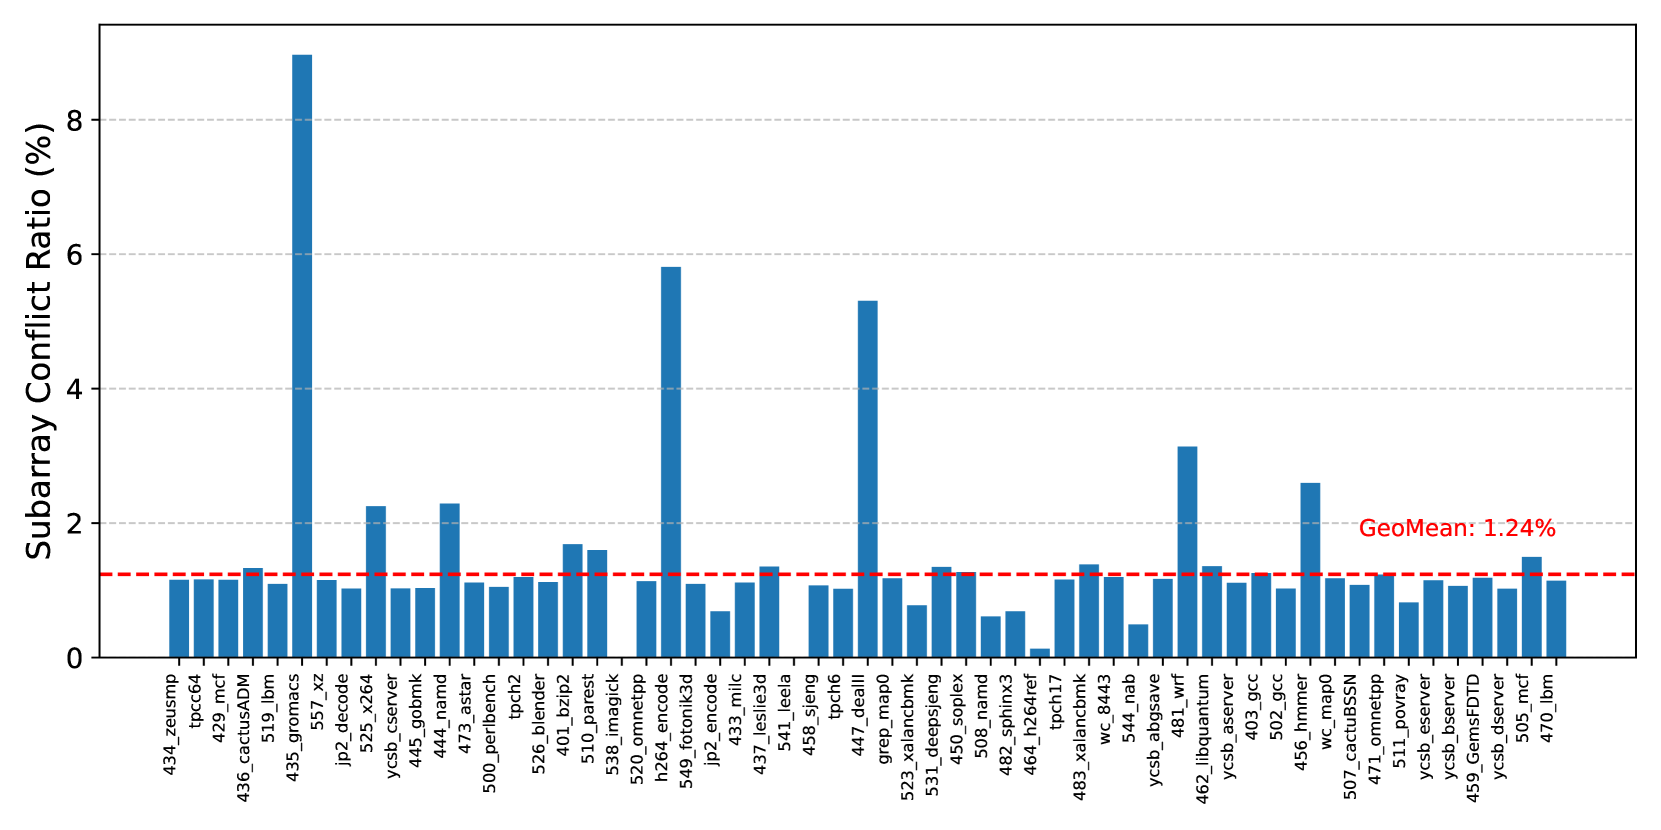
The image presents a bar chart displaying the Subarray Conflict Ratio (%) for a series of identifiers. The chart appears to be comparing the conflict ratio across different systems or components, with a horizontal line indicating the geometric mean.
### Components/Axes
* **Y-axis:** "Subarray Conflict Ratio (%)", ranging from 0 to 8, with increments of 1.
* **X-axis:** A series of identifiers, including: 434\_zeusmcp, 429\_n4, 436\_cactusADM, 519\_lbm, 535\_gromacs, 557\_xz, jp2\_d5e\_x2e, ycsb\_server, 442\_gromk, 471\_tensor, 500\_perbench2, tcdb, 526\_ble\_p2, 401\_pzip2, 516\_imagepk, 520\_omnetpp, 524\_fotonik3d, 549\_leslie3d, 433\_milc, 541\_sheng, 523\_greg\_detail, 447\_tcdb, 531\_x26\_napld, 508\_namd, 464\_h264rx, 482\_sphinx3, 464\_tpcnh7, 483\_xalanc\_843, wc\_8443, ycsb\_abgsve, 544\_lbm, 462\_libquantum, 456\_gcc, 405\_nm\_mpego, 507\_tz\_mpego, 474\_cactusSN, 511\_omnetpp, ycsb\_server, 459\_GemsFDTD, 505\_mcf, 470\_lbm.
* **Horizontal Line:** A dashed orange line labeled "GeoMean: 1.24%". This line represents the geometric mean of the Subarray Conflict Ratio.
### Detailed Analysis
The chart consists of 35 bars, each representing the Subarray Conflict Ratio for a specific identifier. The bars vary significantly in height.
Here's a breakdown of approximate values, reading from left to right:
* 434\_zeusmcp: ~0.8%
* 429\_n4: ~1.2%
* 436\_cactusADM: ~1.6%
* 519\_lbm: ~0.4%
* 535\_gromacs: ~1.0%
* 557\_xz: ~0.6%
* jp2\_d5e\_x2e: ~0.2%
* ycsb\_server: ~0.4%
* 442\_gromk: ~0.8%
* 471\_tensor: ~0.6%
* 500\_perbench2: ~0.4%
* tcdb: ~0.2%
* 526\_ble\_p2: ~0.4%
* 401\_pzip2: ~0.2%
* 516\_imagepk: ~0.6%
* 520\_omnetpp: ~0.8%
* 524\_fotonik3d: ~5.6% (Highest value)
* 549\_leslie3d: ~0.4%
* 433\_milc: ~0.2%
* 541\_sheng: ~0.4%
* 523\_greg\_detail: ~0.2%
* 447\_tcdb: ~0.2%
* 531\_x26\_napld: ~0.2%
* 508\_namd: ~0.4%
* 464\_h264rx: ~0.2%
* 482\_sphinx3: ~0.4%
* 464\_tpcnh7: ~0.2%
* 483\_xalanc\_843: ~0.2%
* wc\_8443: ~0.2%
* ycsb\_abgsve: ~0.4%
* 544\_lbm: ~0.2%
* 462\_libquantum: ~0.4%
* 456\_gcc: ~0.2%
* 405\_nm\_mpego: ~0.2%
* 507\_tz\_mpego: ~0.2%
* 474\_cactusSN: ~0.4%
* 511\_omnetpp: ~0.2%
* ycsb\_server: ~0.4%
* 459\_GemsFDTD: ~0.2%
* 505\_mcf: ~0.2%
* 470\_lbm: ~0.2%
### Key Observations
* The identifier "524\_fotonik3d" has a significantly higher Subarray Conflict Ratio (approximately 5.6%) compared to all other identifiers. This is a clear outlier.
* Most identifiers have a Subarray Conflict Ratio below 1%.
* The geometric mean (1.24%) is relatively low, suggesting that, overall, the Subarray Conflict Ratio is generally low across these identifiers.
* There is a wide range of conflict ratios, indicating varying levels of conflict across the different systems/components.
### Interpretation
The chart demonstrates the distribution of Subarray Conflict Ratios across a set of identifiers. The high conflict ratio observed for "524\_fotonik3d" warrants further investigation. It could indicate a specific issue with that system or component, such as inefficient memory access patterns or contention for shared resources. The geometric mean provides a useful benchmark for assessing the overall performance and identifying potential areas for optimization. The wide variation in conflict ratios suggests that some systems are more prone to conflicts than others, and targeted improvements could be made to reduce these conflicts. The data suggests that the majority of the systems have low conflict ratios, but the outlier highlights a potential problem area. Further analysis would be needed to understand the root cause of the high conflict ratio for "524\_fotonik3d" and determine if similar issues exist in other systems.