# Technical Document Extraction: Graph Neural Network Process Diagram
## 1. Overview
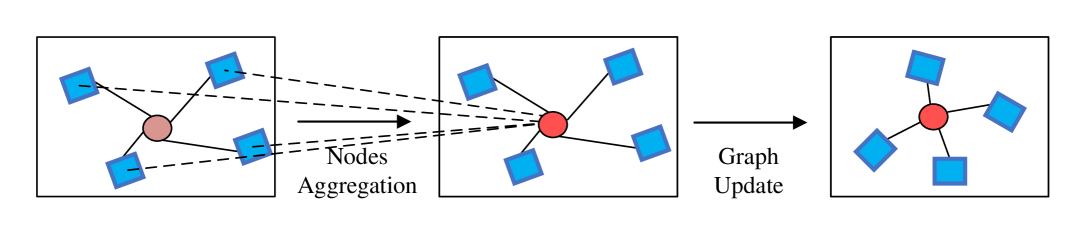
This image is a technical diagram illustrating a two-step process in a Graph Neural Network (GNN) or similar graph-based machine learning architecture. It depicts how information is gathered from neighboring nodes to update a central node's state.
## 2. Component Isolation
The diagram is segmented into three primary stages, moving from left to right, connected by process arrows.
### Region 1: Initial State (Left Box)
* **Components:**
* **Central Node:** A circular node colored in a muted pink/light brown.
* **Neighboring Nodes:** Four blue square nodes surrounding the central node.
* **Edges:** Solid black lines connecting the central node to each of the four blue square nodes.
* **Spatial Layout:** The central node is positioned roughly in the middle of the frame, with neighbors distributed in the top-left, top-right, bottom-left, and bottom-right quadrants.
### Region 2: Nodes Aggregation (Middle Box)
* **Process Label:** "Nodes Aggregation" (located below the arrow connecting Region 1 and Region 2).
* **Components:**
* **Central Node:** The color has changed to a vibrant red, indicating an active state or the result of an operation.
* **Neighboring Nodes:** The same four blue square nodes remain in their positions.
* **Visual Representation:** This stage represents the collection of features or messages from the neighborhood.
### Region 3: Final State (Right Box)
* **Process Label:** "Update" (located below the arrow connecting Region 2 and Region 3).
* **Components:**
* **Central Node:** The node is now a darker, saturated red/maroon.
* **Neighboring Nodes:** The four blue square nodes remain.
* **Visual Representation:** This stage represents the final update of the central node's hidden state based on the aggregated information.