## Bar Chart: Prediction Flip Rate Comparison for Llama-3 Models
### Overview
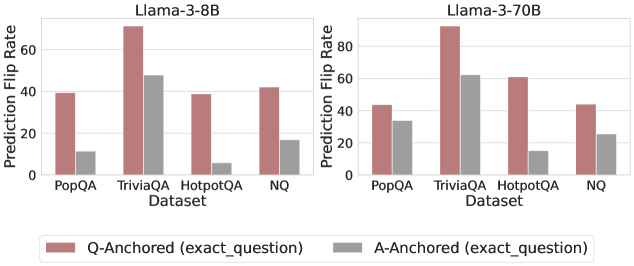
The image presents two bar charts comparing the prediction flip rates of two Llama-3 models (8B and 70B) across four different datasets: PopQA, TriviaQA, HotpotQA, and NQ. The charts compare "Q-Anchored" (exact question) and "A-Anchored" (exact question) scenarios, represented by different colored bars.
### Components/Axes
* **Titles:**
* Left Chart: Llama-3-8B
* Right Chart: Llama-3-70B
* **Y-Axis (Prediction Flip Rate):**
* Label: Prediction Flip Rate
* Scale: 0 to 80, with tick marks at 0, 20, 40, 60, and 80.
* **X-Axis (Dataset):**
* Label: Dataset
* Categories: PopQA, TriviaQA, HotpotQA, NQ
* **Legend (Bottom):**
* Q-Anchored (exact\_question): Represented by a muted red/brown bar.
* A-Anchored (exact\_question): Represented by a gray bar.
### Detailed Analysis
**Left Chart: Llama-3-8B**
* **PopQA:**
* Q-Anchored: Approximately 40
* A-Anchored: Approximately 12
* **TriviaQA:**
* Q-Anchored: Approximately 72
* A-Anchored: Approximately 48
* **HotpotQA:**
* Q-Anchored: Approximately 40
* A-Anchored: Approximately 6
* **NQ:**
* Q-Anchored: Approximately 42
* A-Anchored: Approximately 25
**Right Chart: Llama-3-70B**
* **PopQA:**
* Q-Anchored: Approximately 44
* A-Anchored: Approximately 34
* **TriviaQA:**
* Q-Anchored: Approximately 90
* A-Anchored: Approximately 62
* **HotpotQA:**
* Q-Anchored: Approximately 62
* A-Anchored: Approximately 15
* **NQ:**
* Q-Anchored: Approximately 44
* A-Anchored: Approximately 25
### Key Observations
* For both models, the TriviaQA dataset exhibits the highest prediction flip rate when Q-Anchored.
* The A-Anchored prediction flip rates are generally lower than the Q-Anchored rates across all datasets and both models.
* The Llama-3-70B model generally has higher prediction flip rates than the Llama-3-8B model, especially for TriviaQA and HotpotQA.
### Interpretation
The data suggests that the Llama-3-70B model is more susceptible to prediction flips than the Llama-3-8B model, particularly on the TriviaQA dataset. The difference between Q-Anchored and A-Anchored rates indicates that the way the question is anchored significantly impacts the stability of the model's predictions. The higher flip rates on TriviaQA could be due to the nature of the questions in that dataset, which might be more ambiguous or require more complex reasoning. The lower A-Anchored rates suggest that anchoring on the answer provides more stability in the predictions. The 70B model, being larger, might be overfitting to certain patterns in the training data, leading to higher flip rates when the input is slightly altered.