## Visual Encoding: Shape, Size, and Color
### Overview
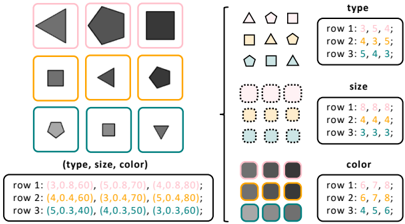
The image presents a 3x3 grid of shapes, each varying in type (triangle, pentagon, square), size, and color. The image also includes data tables that specify the type, size, and color of each shape in the grid. The image demonstrates how visual attributes can be encoded with numerical values.
### Components/Axes
* **Grid:** A 3x3 grid displaying shapes. The rows are visually separated by color-coded borders: pink (row 1), orange (row 2), and teal (row 3).
* **Shapes:** Each cell in the grid contains a shape: triangle, pentagon, or square.
* **Labels:** The image is labeled "(type, size, color)".
* **Data Tables:** Three tables are present, labeled "type", "size", and "color". Each table contains three rows of numerical data corresponding to the rows in the grid.
### Detailed Analysis
**Grid Analysis:**
* **Row 1 (Pink Border):** Triangle, Pentagon, Square.
* **Row 2 (Orange Border):** Square, Triangle, Pentagon.
* **Row 3 (Teal Border):** Pentagon, Square, Triangle.
**Data Table Analysis:**
* **Type Table:**
* Row 1: 3, 5, 4 (Triangle, Pentagon, Square)
* Row 2: 4, 3, 5 (Square, Triangle, Pentagon)
* Row 3: 5, 4, 3 (Pentagon, Square, Triangle)
* **Size Table:**
* Row 1: 8, 8, 8
* Row 2: 4, 4, 4
* Row 3: 3, 3, 3
* **Color Table:**
* Row 1: 6, 7, 8
* Row 2: 6, 7, 8
* Row 3: 4, 5, 6
**Coordinate Data:**
The following data is provided in the format (type, size, color) for each cell in the grid:
* Row 1: (3,0.8,60), (5,0.8,70), (4,0.8,80)
* Row 2: (4,0.4,60), (3,0.4,70), (5,0.4,80)
* Row 3: (5,0.3,40), (4,0.3,50), (3,0.3,60)
### Key Observations
* The "Type Table" assigns numerical values to the shapes: 3 for Triangle, 4 for Square, and 5 for Pentagon.
* The "Size Table" indicates a consistent size within each row, with Row 1 having the largest size (8), Row 2 a medium size (4), and Row 3 the smallest size (3).
* The "Color Table" shows a progression of color values within each row.
* The coordinate data provides a more detailed numerical representation of each shape's attributes.
### Interpretation
The image demonstrates a visual encoding scheme where shapes, sizes, and colors are mapped to numerical values. The grid visually represents the data, while the tables provide a structured numerical representation. The coordinate data offers a more precise numerical description of each shape's attributes. This type of encoding is commonly used in data visualization and machine learning to represent categorical and continuous variables. The image effectively illustrates how visual attributes can be translated into numerical data for analysis and processing.