\n
## Diagram: Shape Attribute Decomposition
### Overview
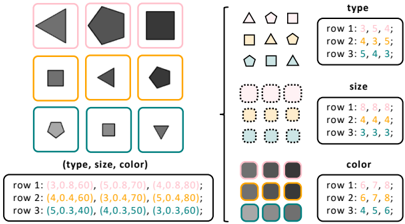
The image presents a diagram illustrating the decomposition of a set of shapes based on three attributes: type, size, and color. A 3x3 grid of shapes is shown on the left, with corresponding attribute representations on the right, organized into "type", "size", and "color" categories. The attributes are represented numerically in a table at the bottom.
### Components/Axes
The diagram is divided into four main sections:
1. **Shape Grid:** A 3x3 grid containing nine shapes, each enclosed in a colored box.
2. **Type Legend:** A grid of shape outlines representing different types (triangle, pentagon, square).
3. **Size Legend:** A grid of circles with varying sizes, representing different size categories.
4. **Color Legend:** A grid of colored squares representing different color shades.
5. **Attribute Table:** A table listing the (type, size, color) values for each shape in the grid.
The axes are implicit, defined by the rows and columns of the grids and the table. The legends provide the mapping between visual elements and numerical values.
### Detailed Analysis or Content Details
**Shape Grid:**
The shapes are arranged in a 3x3 grid. Each shape is enclosed in a colored border.
- Row 1: Triangle (pink), Pentagon (yellow), Square (gray)
- Row 2: Square (orange), Triangle (yellow), Pentagon (teal)
- Row 3: Pentagon (teal), Square (gray), Triangle (blue)
**Type Legend:**
The legend shows three shape types:
- Triangle: Represented by the symbol "△"
- Pentagon: Represented by the symbol "☆"
- Square: Represented by the symbol "□"
The legend is organized into a 3x3 grid with the following values:
- Row 1: 3, 5, .
- Row 2: 4, 3, 4
- Row 3: 5, 4, 3
**Size Legend:**
The legend shows three size categories, represented by circles of different sizes.
- Small: Represented by a small circle "●"
- Medium: Represented by a medium circle "●"
- Large: Represented by a large circle "●"
The legend is organized into a 3x3 grid with the following values:
- Row 1: 8, 8, 8
- Row 2: 4, 4, 4
- Row 3: 3, 3, 3
**Color Legend:**
The legend shows three color shades, represented by colored squares.
- Light Gray: Represented by a light gray square.
- Medium Gray: Represented by a medium gray square.
- Dark Gray: Represented by a dark gray square.
The legend is organized into a 3x3 grid with the following values:
- Row 1: 6, 7, 8
- Row 2: 6, 7, 8
- Row 3: 4, 5, 6
**Attribute Table:**
The table lists the (type, size, color) values for each shape in the grid. The values are represented as tuples.
- Row 1: (3.0, 8.60), (5.0, 8.70), (4.0, 8.80)
- Row 2: (4.0, 5.30), (3.0, 4.70), (5.0, 4.80)
- Row 3: (5.0, 3.40), (4.0, 3.50), (3.0, 3.60)
### Key Observations
- Each shape in the grid is uniquely defined by its type, size, and color.
- The attribute table provides a numerical representation of these attributes.
- The legends provide a mapping between visual elements and numerical values.
- The values in the attribute table appear to be floating-point numbers, suggesting a continuous or fine-grained representation of the attributes.
### Interpretation
The diagram demonstrates a method for representing complex objects (shapes) using a set of attributes. The decomposition into type, size, and color allows for a structured and quantifiable description of each shape. The numerical representation in the attribute table facilitates data analysis and comparison. The legends serve as a key to translate between visual and numerical representations.
The diagram suggests a system for categorizing and classifying shapes based on their inherent properties. This could be used in various applications, such as image recognition, object detection, or data visualization. The use of numerical values for attributes allows for more precise and nuanced descriptions than simple categorical labels. The arrangement of the shapes and attributes in a grid format provides a clear and organized visual representation of the data.