# Technical Document Extraction: Cause-Effect Matrix
## 1. Image Overview
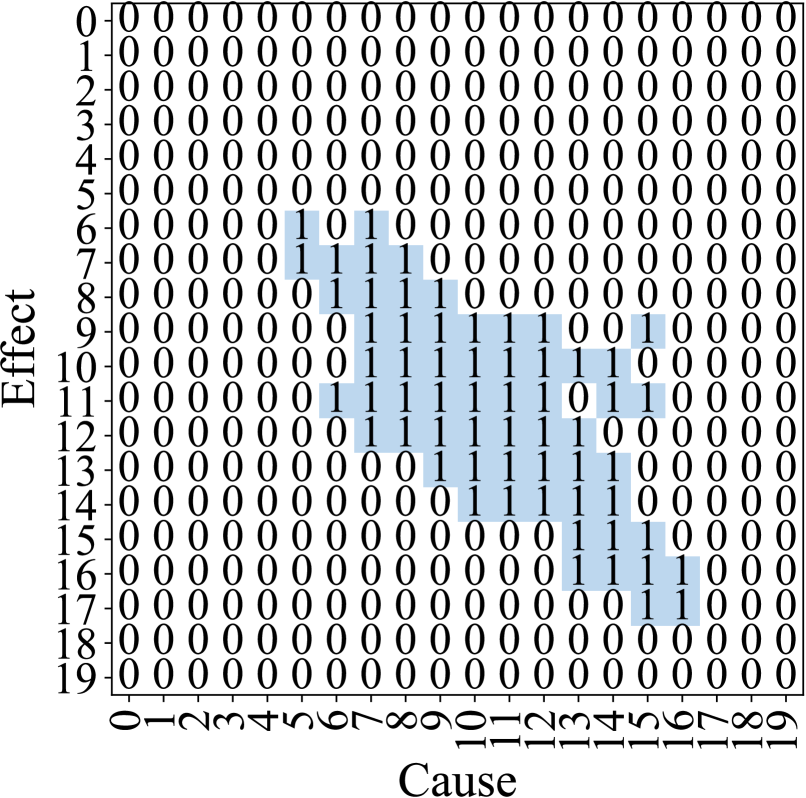
This image is a technical visualization of a binary matrix, likely representing a causal relationship or a reachability matrix in a system analysis. It maps "Cause" (horizontal axis) against "Effect" (vertical axis).
## 2. Component Isolation
### Header/Labels
- **Vertical Axis (Y-Axis):** Labeled "Effect". It contains numerical markers from **0 to 19**.
- **Horizontal Axis (X-Axis):** Labeled "Cause". It contains numerical markers from **0 to 19**.
### Main Chart Area
- **Data Type:** Binary Matrix (values are either `0` or `1`).
- **Visual Encoding:**
- Cells containing `0` have a white background.
- Cells containing `1` are highlighted with a light blue background.
- **Trend Observation:** The "1" values form a diagonal cluster starting around Cause 5, Effect 6 and extending to Cause 17, Effect 17. This indicates a delayed causal relationship where causes at time $t$ result in effects at time $t+n$.
---
## 3. Data Table Reconstruction
The following table represents the $20 \times 20$ matrix. Rows represent **Effect** (0-19) and columns represent **Cause** (0-19).
| Effect \ Cause | 0 | 1 | 2 | 3 | 4 | 5 | 6 | 7 | 8 | 9 | 10 | 11 | 12 | 13 | 14 | 15 | 16 | 17 | 18 | 19 |
| :--- | :-: | :-: | :-: | :-: | :-: | :-: | :-: | :-: | :-: | :-: | :-: | :-: | :-: | :-: | :-: | :-: | :-: | :-: | :-: | :-: |
| **0** | 0 | 0 | 0 | 0 | 0 | 0 | 0 | 0 | 0 | 0 | 0 | 0 | 0 | 0 | 0 | 0 | 0 | 0 | 0 | 0 |
| **1** | 0 | 0 | 0 | 0 | 0 | 0 | 0 | 0 | 0 | 0 | 0 | 0 | 0 | 0 | 0 | 0 | 0 | 0 | 0 | 0 |
| **2** | 0 | 0 | 0 | 0 | 0 | 0 | 0 | 0 | 0 | 0 | 0 | 0 | 0 | 0 | 0 | 0 | 0 | 0 | 0 | 0 |
| **3** | 0 | 0 | 0 | 0 | 0 | 0 | 0 | 0 | 0 | 0 | 0 | 0 | 0 | 0 | 0 | 0 | 0 | 0 | 0 | 0 |
| **4** | 0 | 0 | 0 | 0 | 0 | 0 | 0 | 0 | 0 | 0 | 0 | 0 | 0 | 0 | 0 | 0 | 0 | 0 | 0 | 0 |
| **5** | 0 | 0 | 0 | 0 | 0 | 0 | 0 | 0 | 0 | 0 | 0 | 0 | 0 | 0 | 0 | 0 | 0 | 0 | 0 | 0 |
| **6** | 0 | 0 | 0 | 0 | 0 | **1** | 0 | **1** | 0 | 0 | 0 | 0 | 0 | 0 | 0 | 0 | 0 | 0 | 0 | 0 |
| **7** | 0 | 0 | 0 | 0 | 0 | **1** | **1** | **1** | **1** | 0 | 0 | 0 | 0 | 0 | 0 | 0 | 0 | 0 | 0 | 0 |
| **8** | 0 | 0 | 0 | 0 | 0 | 0 | **1** | **1** | **1** | **1** | 0 | 0 | 0 | 0 | 0 | 0 | 0 | 0 | 0 | 0 |
| **9** | 0 | 0 | 0 | 0 | 0 | 0 | 0 | **1** | **1** | **1** | **1** | **1** | **1** | 0 | 0 | **1** | 0 | 0 | 0 | 0 |
| **10** | 0 | 0 | 0 | 0 | 0 | 0 | 0 | **1** | **1** | **1** | **1** | **1** | **1** | **1** | **1** | 0 | 0 | 0 | 0 | 0 |
| **11** | 0 | 0 | 0 | 0 | 0 | 0 | **1** | **1** | **1** | **1** | **1** | **1** | **1** | 0 | **1** | **1** | 0 | 0 | 0 | 0 |
| **12** | 0 | 0 | 0 | 0 | 0 | 0 | 0 | **1** | **1** | **1** | **1** | **1** | **1** | **1** | 0 | 0 | 0 | 0 | 0 | 0 |
| **13** | 0 | 0 | 0 | 0 | 0 | 0 | 0 | 0 | 0 | **1** | **1** | **1** | **1** | **1** | **1** | 0 | 0 | 0 | 0 | 0 |
| **14** | 0 | 0 | 0 | 0 | 0 | 0 | 0 | 0 | 0 | 0 | **1** | **1** | **1** | **1** | **1** | 0 | 0 | 0 | 0 | 0 |
| **15** | 0 | 0 | 0 | 0 | 0 | 0 | 0 | 0 | 0 | 0 | 0 | 0 | 0 | **1** | **1** | **1** | **1** | 0 | 0 | 0 |
| **16** | 0 | 0 | 0 | 0 | 0 | 0 | 0 | 0 | 0 | 0 | 0 | 0 | 0 | **1** | **1** | **1** | **1** | 0 | 0 | 0 |
| **17** | 0 | 0 | 0 | 0 | 0 | 0 | 0 | 0 | 0 | 0 | 0 | 0 | 0 | 0 | 0 | **1** | **1** | 0 | 0 | 0 |
| **18** | 0 | 0 | 0 | 0 | 0 | 0 | 0 | 0 | 0 | 0 | 0 | 0 | 0 | 0 | 0 | 0 | 0 | 0 | 0 | 0 |
| **19** | 0 | 0 | 0 | 0 | 0 | 0 | 0 | 0 | 0 | 0 | 0 | 0 | 0 | 0 | 0 | 0 | 0 | 0 | 0 | 0 |
---
## 4. Detailed Data Analysis
### Active Regions (The "1" Cluster)
The matrix is sparse, with the majority of values being `0`. The "active" causal relationships (marked as `1`) are concentrated in the following coordinates:
* **Effect 6:** Causes {5, 7}
* **Effect 7:** Causes {5, 6, 7, 8}
* **Effect 8:** Causes {6, 7, 8, 9}
* **Effect 9:** Causes {7, 8, 9, 10, 11, 12, 15}
* **Effect 10:** Causes {7, 8, 9, 10, 11, 12, 13, 14}
* **Effect 11:** Causes {6, 7, 8, 9, 10, 11, 12, 14, 15}
* **Effect 12:** Causes {7, 8, 9, 10, 11, 12, 13}
* **Effect 13:** Causes {9, 10, 11, 12, 13, 14}
* **Effect 14:** Causes {10, 11, 12, 13, 14}
* **Effect 15:** Causes {13, 14, 15, 16}
* **Effect 16:** Causes {13, 14, 15, 16}
* **Effect 17:** Causes {15, 16}
### Null Regions
* **Rows 0-5 and 18-19:** Contain exclusively `0`s across all causes.
* **Columns 0-4 and 17-19:** Contain exclusively `0`s across all effects.
### Structural Observations
1. **Diagonal Nature:** The data points follow a roughly diagonal path from the top-left of the center to the bottom-right of the center.
2. **Discontinuities:** There are internal "holes" (zeros surrounded by ones), such as at (Cause 6, Effect 6) and (Cause 13, Effect 11).
3. **Symmetry:** The matrix is not perfectly symmetrical, suggesting a directed relationship where the influence of a Cause on an Effect is specific to the time/index offset.