## Neural Network Diagram: Memory Access Visualization
### Overview
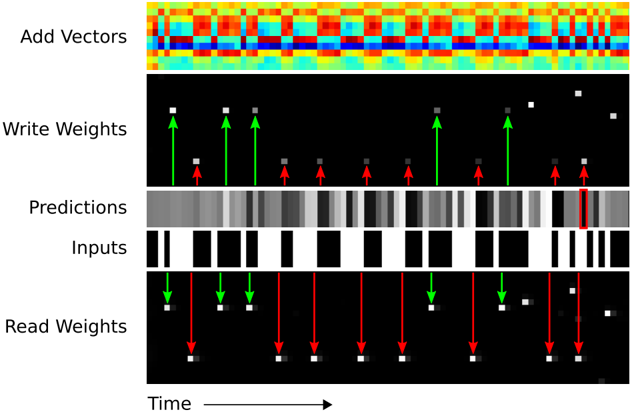
The image is a visualization of memory access patterns in a neural network over time. It shows how vectors are added, weights are written and read, and how these actions relate to the network's inputs and predictions. The diagram is structured vertically, with time progressing horizontally from left to right.
### Components/Axes
* **Vertical Sections (Top to Bottom):**
* Add Vectors
* Write Weights
* Predictions
* Inputs
* Read Weights
* **Horizontal Axis:**
* Labeled "Time" with an arrow indicating the direction of time's progression.
* **Arrows:**
* Green arrows indicate successful or positive actions.
* Red arrows indicate unsuccessful or negative actions.
### Detailed Analysis or ### Content Details
1. **Add Vectors:**
* A heatmap-like representation showing the addition of vectors over time. The colors range from blue to red, potentially indicating the magnitude or frequency of vector additions. The pattern appears somewhat periodic.
* The heatmap consists of a grid of colored squares. The colors vary from blue to green to yellow to red. The pattern is complex, but there are some repeating elements.
2. **Write Weights:**
* A black background with white/gray squares representing the weights being written.
* Green arrows point upwards from the "Inputs" section to the "Write Weights" section, indicating when a weight is successfully written.
* Red arrows point upwards from the "Inputs" section to the "Write Weights" section, indicating when a weight write fails.
* The squares vary in intensity, with some being brighter than others.
3. **Predictions:**
* A grayscale bar representing the network's predictions over time. The intensity of the gray likely corresponds to the confidence or value of the prediction.
* The predictions vary in intensity, with some being darker than others.
4. **Inputs:**
* A binary representation of the input data over time, with black representing 0 and white representing 1.
* The inputs are represented as black and white bars. The pattern of black and white bars represents the input data.
5. **Read Weights:**
* A black background with white/gray squares representing the weights being read.
* Green arrows point downwards from the "Inputs" section to the "Read Weights" section, indicating when a weight is successfully read.
* Red arrows point downwards from the "Inputs" section to the "Read Weights" section, indicating when a weight read fails.
* The squares vary in intensity, with some being brighter than others.
### Key Observations
* The "Add Vectors" section shows a complex, potentially periodic pattern of vector additions.
* The "Write Weights" and "Read Weights" sections show sparse activity, with only a few weights being written or read at any given time.
* The "Predictions" section shows a continuous stream of predictions, with varying levels of confidence.
* The "Inputs" section shows a binary input pattern, with alternating sequences of 0s and 1s.
* The green and red arrows indicate the success or failure of weight writes and reads, providing insight into the network's learning process.
### Interpretation
The diagram provides a visual representation of the internal workings of a neural network, specifically focusing on memory access patterns. By visualizing the addition of vectors, the writing and reading of weights, the network's predictions, and the input data, the diagram offers insights into how the network learns and makes decisions. The green and red arrows highlight the success or failure of weight operations, which can be used to diagnose potential issues in the network's training process. The periodic pattern in the "Add Vectors" section may indicate a cyclical process within the network. The varying intensities in the "Predictions" section suggest different levels of confidence in the network's outputs. The diagram could be used to optimize the network's architecture or training process by identifying bottlenecks or inefficiencies in memory access.