## Diagram: Neural Network Operation Phases
### Overview
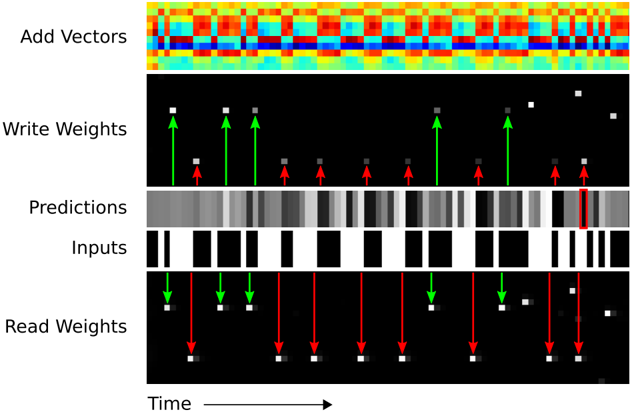
The diagram illustrates a temporal sequence of operations in a neural network, divided into five horizontal sections. Each section represents a distinct computational phase with visual elements indicating data flow, weight updates, and prediction mechanisms. The timeline progresses from left to right.
### Components/Axes
- **X-axis**: Labeled "Time" with an arrow indicating progression.
- **Sections**:
1. **Add Vectors**: Topmost section with a heatmap of red, blue, and yellow pixels.
2. **Write Weights**: Second section with black background, white/gray squares, and green/red upward arrows.
3. **Predictions**: Third section with grayscale heatmap.
4. **Inputs**: Fourth section with black/white vertical bars.
5. **Read Weights**: Bottom section with black background, white/gray squares, and green/red downward arrows.
### Detailed Analysis
1. **Add Vectors**:
- Heatmap with horizontal bands of red (high intensity), blue (low intensity), and yellow (intermediate intensity).
- No explicit axis labels beyond "Time" on the x-axis.
- Pattern suggests periodic or grouped vector additions.
2. **Write Weights**:
- White squares (active weights) and gray squares (inactive weights) on black background.
- Green arrows (↑) indicate positive weight updates; red arrows (↑) indicate negative updates.
- Arrows originate from squares, suggesting localized adjustments.
3. **Predictions**:
- Grayscale heatmap with darker regions (likely higher prediction confidence/error) and lighter regions.
- Vertical variation suggests temporal changes in prediction quality.
4. **Inputs**:
- Binary black/white vertical bars alternating in presence/absence.
- Regular spacing implies discrete input events over time.
5. **Read Weights**:
- Mirror of "Write Weights" but with downward arrows (↓).
- Red arrows (↓) dominate, suggesting predominant negative read adjustments.
### Key Observations
- **Temporal Correlation**: All sections align horizontally, implying synchronized operations across phases.
- **Weight Dynamics**: Green/red arrows in "Write Weights" and "Read Weights" suggest bidirectional adjustments during training/inference.
- **Input-Output Relationship**: Inputs (binary bars) precede predictions, with weight updates occurring between phases.
- **Heatmap Symmetry**: "Add Vectors" and "Predictions" heatmaps show horizontal periodicity, possibly reflecting batch processing.
### Interpretation
This diagram visualizes a neural network's forward and backward pass mechanics:
1. **Vector Addition**: Initial feature combination (top heatmap).
2. **Weight Updates**: Gradient descent adjustments during training (middle sections).
3. **Prediction Phase**: Output generation (grayscale heatmap).
4. **Input Processing**: Binary event handling (black/white bars).
5. **Weight Reading**: Parameter retrieval during inference (bottom section).
The alternating green/red arrows in weight sections imply opposing update directions, likely representing positive/negative gradient steps. The absence of explicit numerical values or legends limits quantitative analysis but highlights the system's operational flow. The binary input pattern suggests a spike-timing-dependent plasticity (STDP)-like mechanism, where discrete events trigger weight modifications.