\n
## Scatter Plot: Medical Genetics - Confidence vs. Target Length
### Overview
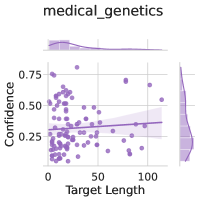
The image presents a scatter plot visualizing the relationship between "Target Length" and "Confidence" in the context of medical genetics. A regression line with a shaded confidence interval is overlaid on the scatter points. Marginal distributions (density plots) are displayed at the top and right sides of the chart, showing the distribution of "Target Length" and "Confidence" respectively.
### Components/Axes
* **Title:** "medical\_genetics" (top-center)
* **X-axis:** "Target Length" (bottom-center), ranging from approximately 0 to 110.
* **Y-axis:** "Confidence" (left-center), ranging from approximately 0.15 to 0.80.
* **Scatter Points:** Numerous purple dots representing individual data points.
* **Regression Line:** A dark purple line representing the trend in the data.
* **Confidence Interval:** A light purple shaded area around the regression line, indicating the uncertainty in the estimated trend.
* **Marginal Distribution (Top):** A density plot showing the distribution of "Target Length".
* **Marginal Distribution (Right):** A density plot showing the distribution of "Confidence".
### Detailed Analysis
The scatter plot shows a weak positive correlation between "Target Length" and "Confidence".
* **Scatter Points Trend:** The points are scattered with no strong clustering. There's a slight tendency for confidence to increase with target length, but the spread is significant.
* **Regression Line Trend:** The regression line slopes slightly upward, confirming the weak positive correlation.
* **Regression Line Equation (Approximate):** Visually, the line appears to intersect the Y-axis around 0.25 and has a very shallow slope.
* **Data Points (Approximate):**
* At Target Length = 0, Confidence ranges from approximately 0.15 to 0.65.
* At Target Length = 50, Confidence ranges from approximately 0.20 to 0.60.
* At Target Length = 100, Confidence ranges from approximately 0.30 to 0.75.
* **Marginal Distribution - Target Length:** The distribution is roughly uniform, with a slight skew towards lower values. The peak density is around a Target Length of 10.
* **Marginal Distribution - Confidence:** The distribution is skewed to the right, with a peak density around a Confidence of 0.25.
### Key Observations
* The relationship between "Target Length" and "Confidence" is weak.
* The confidence interval around the regression line is relatively wide, indicating high uncertainty in the estimated trend.
* The marginal distributions suggest that "Target Length" is relatively evenly distributed, while "Confidence" is concentrated at lower values.
* There are a few outliers with high confidence values (above 0.70), but they are relatively rare.
### Interpretation
The data suggests that "Target Length" is not a strong predictor of "Confidence" in this medical genetics context. While there's a slight tendency for confidence to increase with target length, the relationship is weak and highly variable. The wide confidence interval indicates that other factors likely play a more significant role in determining confidence. The skewed distribution of "Confidence" suggests that low confidence is more common than high confidence. The marginal distributions provide insights into the range and distribution of each variable independently. The plot could be visualizing the confidence in genetic sequence alignment or variant calling, where longer target sequences don't necessarily guarantee higher confidence in the results. The lack of a strong correlation might indicate the need for more sophisticated models or additional data features to improve confidence prediction.