TECHNICAL ASSET FINGERPRINT
f1da4250e621dfc2f487416c
Click to view fullscreen
Press ESC or click to close
FOUND IN PAPERS
EXPERT: gemini-2.0-flash VERSION 1
RUNTIME: nugit/gemini/gemini-2.0-flash
INTEL_VERIFIED
## Clinical Diagnosis Diagram: GERD vs. Suspected PBC
### Overview
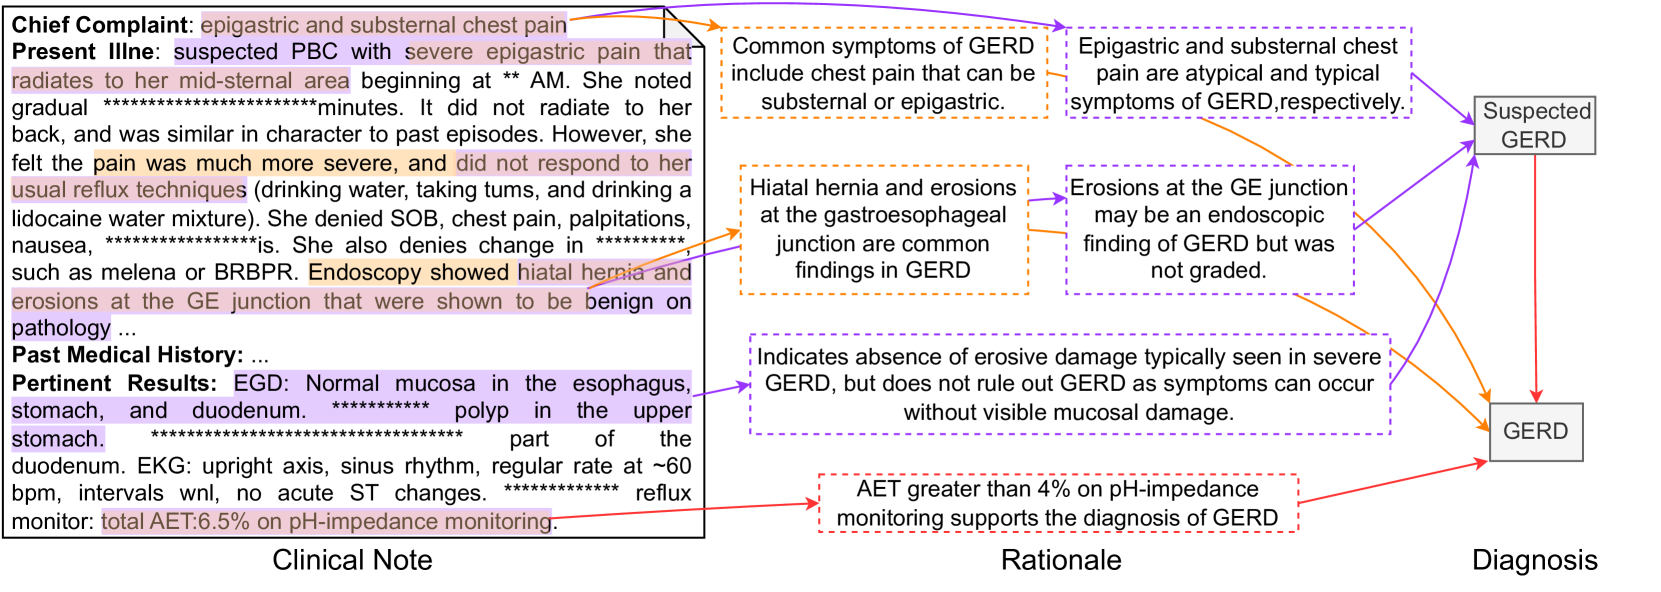
The image presents a clinical diagnostic diagram that differentiates between suspected Primary Biliary Cholangitis (PBC) and Gastroesophageal Reflux Disease (GERD). It connects clinical notes, rationale, and diagnosis through a series of statements and arrows, illustrating the thought process behind diagnosing GERD.
### Components/Axes
* **Clinical Note:** Contains patient's chief complaint, present illness, past medical history, and pertinent results from examinations.
* **Rationale:** Provides supporting statements and common findings related to GERD.
* **Diagnosis:** Indicates the final diagnosis of GERD.
* **Nodes:**
* "Suspected GERD" - A preliminary diagnostic consideration.
* "GERD" - The final diagnosis.
* **Connectors:** Arrows linking clinical findings to rationale and ultimately to the diagnosis.
* **Color Coding:**
* Purple arrows connect clinical findings to the "Suspected GERD" node.
* Orange arrows connect clinical findings and rationale to the "GERD" node.
* Red arrows connect specific clinical results to the "GERD" node.
### Detailed Analysis or Content Details
**Clinical Note (Left Side):**
* **Chief Complaint:** epigastric and substernal chest pain
* **Present Illness:** suspected PBC with severe epigastric pain that radiates to her mid-sternal area beginning at \*\* AM. She noted gradual \*\*\*\*\*\*\*\*\*\*\*\*\*\*\*\*\*\*\*\*\*\*\*\*\*\*\*\*\*\*\*\*\*\*\*\*\*\*\*\*\*\*\*\*\*\*\*\*\*\*\*\*\*\*\*\*\*\*\*\*\*\*\*\*\*\*\*\*\*\*\*\*\*\*\*\*\*\*\*\*\*\*\*\*\*\*\*\*\*\*\*\*\*\*\*\*\*\*\*\*\*\*\*\*\*\*\*\*\*\*\*\*\*\*\*\*\*\*\*\*\*\*\*\*\*\*\*\*\*\*\*\*\*\*\*\*\*\*\*\*\*\*\*\*\*\*\*\*\*\*\*\*\*\*\*\*\*\*\*\*\*\*\*\*\*\*\*\*\*\*\*\*\*\*\*\*\*\*\*\*\*\*\*\*\*\*\*\*\*\*\*\*\*\*\*\*\*\*\*\*\*\*\*\*\*\*\*\*\*\*\*\*\*\*\*\*\*\*\*\*\*\*\*\*\*\*\*\*\*\*\*\*\*\*\*\*\*\*\*\*\*\*\*\*\*\*\*\*\*\*\*\*\*\*\*\*\*\*\*\*\*\*\*\*\*\*\*\*\*\*\*\*\*\*\*\*\*\*\*\*\*\*\*\*\*\*\*\*\*\*\*\*\*\*\*\*\*\*\*\*\*\*\*\*\*\*\*\*\*\*\*\*\*\*\*\*\*\*\*\*\*\*\*\*\*\*\*\*\*\*\*\*\*\*\*\*\*\*\*\*\*\*\*\*\*\*\*\*\*\*\*\*\*\*\*\*\*\*\*\*\*\*\*\*\*\*\*\*\*\*\*\*\*\*\*\*\*\*\*\*\*\*\*\*\*\*\*\*\*\*\*\*\*\*\*\*\*\*\*\*\*\*\*\*\*\*\*\*\*\*\*\*\*\*\*\*\*\*\*\*\*\*\*\*\*\*\*\*\*\*\*\*\*\*\*\*\*\*\*\*\*\*\*\*\*\*\*\*\*\*\*\*\*\*\*\*\*\*\*\*\*\*\*\*\*\*\*\*\*\*\*\*\*\*\*\*\*\*\*\*\*\*\*\*\*\*\*\*\*\*\*\*\*\*\*\*\*\*\*\*\*\*\*\*\*\*\*\*\*\*\*\*\*\*\*\*\*\*\*\*\*\*\*\*\*\*\*\*\*\*\*\*\*\*\*\*\*\*\*\*\*\*\*\*\*\*\*\*\*\*\*\*\*\*\*\*\*\*\*\*\*\*\*\*\*\*\*\*\*\*\*\*\*\*\*\*\*\*\*\*\*\*\*\*\*\*\*\*\*\*\*\*\*\*\*\*\*\*\*\*\*\*\*\*\*\*\*\*\*\*\*\*\*\*\*\*\*\*\*\*\*\*\*\*\*\*\*\*\*\*\*\*\*\*\*\*\*\*\*\*\*\*\*\*\*\*\*\*\*\*\*\*\*\*\*\*\*\*\*\*\*\*\*\*\*\*\*\*\*\*\*\*\*\*\*\*\*\*\*\*\*\*\*\*\*\*\*\*\*\*\*\*\*\*\*\*\*\*\*\*\*\*\*\*\*\*\*\*\*\*\*\*\*\*\*\*\*\*\*\*\*\*\*\*\*\*\*\*\*\*\*\*\*\*\*\*\*\*\*\*\*\*\*\*\*\*\*\*\*\*\*\*\*\*\*\*\*\*\*\*\*\*\*\*\*\*\*\*\*\*\*\*\*\*\*\*\*\*\*\*\*\*\*\*\*\*\*\*\*\*\*\*\*\*\*\*\*\*\*\*\*\*\*\*\*\*\*\*\*\*\*\*\*\*\*\*\*\*\*\*\*\*\*\*\*\*\*\*\*\*\*\*\*\*\*\*\*\*\*\*\*\*\*\*\*\*\*\*\*\*\*\*\*\*\*\*\*\*\*\*\*\*\*\*\*\*\*\*\*\*\*\*\*\*\*\*\*\*\*\*\*\*\*\*\*\*\*\*\*\*\*\*\*\*\*\*\*\*\*\*\*\*\*\*\*\*\*\*\*\*\*\*\*\*\*\*\*\*\*\*\*\*\*\*\*\*\*\*\*\*\*\*\*\*\*\*\*\*\*\*\*\*\*\*\*\*\*\*\*\*\*\*\*\*\*\*\*\*\*\*\*\*\*\*\*\*\*\*\*\*\*\*\*\*\*\*\*\*\*\*\*\*\*\*\*\*\*\*\*\*\*\*\*\*\*\*\*\*\*\*\*\*\*\*\*\*\*\*\*\*\*\*\*\*\*\*\*\*\*\*\*\*\*\*\*\*\*\*\*\*\*\*\*\*\*\*\*\*\*\*\*\*\*\*\*\*\*\*\*\*\*\*\*\*\*\*\*\*\*\*\*\*\*\*\*\*\*\*\*\*\*\*\*\*\*\*\*\*\*\*\*\*\*\*\*\*\*\*\*\*\*\*\*\*\*\*\*\*\*\*\*\*\*\*\*\*\*\*\*\*\*\*\*\*\*\*\*\*\*\*\*\*\*\*\*\*\*\*\*\*\*\*\*\*\*\*\*\*\*\*\*\*\*\*\*\*\*\*\*\*\*\*\*\*\*\*\*\*\*\*\*\*\*\*\*\*\*\*\*\*\*\*\*\*\*\*\*\*\*\*\*\*\*\*\*\*\*\*\*\*\*\*\*\*\*\*\*\*\*\*\*\*\*\*\*\*\*\*\*\*\*\*\*\*\*\*\*\*\*\*\*\*\*\*\*\*\*\*\*\*\*\*\*\*\*\*\*\*\*\*\*\*\*\*\*\*\*\*\*\*\*\*\*\*\*\*\*\*\*\*\*\*\*\*\*\*\*\*\*\*\*\*\*\*\*\*\*\*\*\*\*\*\*\*\*\*\*\*\*\*\*\*\*\*\*\*\*\*\*\*\*\*\*\*\*\*\*\*\*\*\*\*\*\*\*\*\*\*\*\*\*\*\*\*\*\*\*\*\*\*\*\*\*\*\*\*\*\*\*\*\*\*\*\*\*\*\*\*\*\*\*\*\*\*\*\*\*\*\*\*\*\*\*\*\*\*\*\*\*\*\*\*\*\*\*\*\*\*\*\*\*\*\*\*\*\*\*\*\*\*\*\*\*\*\*\*\*\*\*\*\*\*\*\*\*\*\*\*\*\*\*\*\*\*\*\*\*\*\*\*\*\*\*\*\*\*\*\*\*\*\*\*\*\*\*\*\*\*\*\*\*\*\*\*\*\*\*\*\*\*\*\*\*\*\*\*\*\*\*\*\*\*\*\*\*\*\*\*\*\*\*\*\*\*\*\*\*\*\*\*\*\*\*\*\*\*\*\*\*\*\*\*\*\*\*\*\*\*\*\*\*\*\*\*\*\*\*\*\*\*\*\*\*\*\*\*\*\*\*\*\*\*\*\*\*\*\*\*\*\*\*\*\*\*\*\*\*\*\*\*\*\*\*\*\*\*\*\*\*\*\*\*\*\*\*\*\*\*\*\*\*\*\*\*\*\*\*\*\*\*\*\*\*\*\*\*\*\*\*\*\*\*\*\*\*\*\*\*\*\*\*\*\*\*\*\*\*\*\*\*\*\*\*\*\*\*\*\*\*\*\*\*\*\*\*\*\*\*\*\*\*\*\*\*\*\*\*\*\*\*\*\*\*\*\*\*\*\*\*\*\*\*\*\*\*\*\*\*\*\*\*\*\*\*\*\*\*\*\*\*\*\*\*\*\*\*\*\*\*\*\*\*\*\*\*\*\*\*\*\*\*\*\*\*\*\*\*\*\*\*\*\*\*\*\*\*\*\*\*\*\*\*\*\*\*\*\*\*\*\*\*\*\*\*\*\*\*\*\*\*\*\*\*\*\*\*\*\*\*\*\*\*\*\*\*\*\*\*\*\*\*\*\*\*\*\*\*\*\*\*\*\*\*\*\*\*\*\*\*\*\*\*\*\*\*\*\*\*\*\*\*\*\*\*\*\*\*\*\*\*\*\*\*\*\*\*\*\*\*\*\*\*\*\*\*\*\*\*\*\*\*\*\*\*\*\*\*\*\*\*\*\*\*\*\*\*\*\*\*\*\*\*\*\*\*\*\*\*\*\*\*\*\*\*\*\*\*\*\*\*\*\*\*\*\*\*\*\*\*\*\*\*\*\*\*\*\*\*\*\*\*\*\*\*\*\*\*\*\*\*\*\*\*\*\*\*\*\*\*\*\*\*\*\*\*\*\*\*\*\*\*\*\*\*\*\*\*\*\*\*\*\*\*\*\*\*\*\*\*\*\*\*\*\*\*\*\*\*\*\*\*\*\*\*\*\*\*\*\*\*\*\*\*\*\*\*\*\*\*\*\*\*\*\*\*\*\*\*\*\*\*\*\*\*\*\*\*\*\*\*\*\*\*\*\*\*\*\*\*\*\*\*\*\*\*\*\*\*\*\*\*\*\*\*\*\*\*\*\*\*\*\*\*\*\*\*\*\*\*\*\*\*\*\*\*\*\*\*\*\*\*\*\*\*\*\*\*\*\*\*\*\*\*\*\*\*\*\*\*\*\*\*\*\*\*\*\*\*\*\*\*\*\*\*\*\*\*\*\*\*\*\*\*\*\*\*\*\*\*\*\*\*\*\*\*\*\*\*\*\*\*\*\*\*\*\*\*\*\*\*\*\*\*\*\*\*\*\*\*\*\*\*\*\*\*\*\*\*\*\*\*\*\*\*\*\*\*\*\*\*\*\*\*\*\*\*\*\*\*\*\*\*\*\*\*\*\*\*\*\*\*\*\*\*\*\*\*\*\*\*\*\*\*\*\*\*\*\*\*\*\*\*\*\*\*\*\*\*\*\*\*\*\*\*\*\*\*\*\*\*\*\*\*\*\*\*\*\*\*\*\*\*\*\*\*\*\*\*\*\*\*\*\*\*\*\*\*\*\*\*\*\*\*\*\*\*\*\*\*\*\*\*\*\*\*\*\*\*\*\*\*\*\*\*\*\*\*\*\*\*\*\*\*\*\*\*\*\*\*\*\*\*\*\*\*\*\*\*\*\*\*\*\*\*\*\*\*\*\*\*\*\*\*\*\*\*\*\*\*\*\*\*\*\*\*\*\*\*\*\*\*\*\*\*\*\*\*\*\*\*\*\*\*\*\*\*\*\*\*\*\*\*\*\*\*\*\*\*\*\*\*\*\*\*\*\*\*\*\*\*\*\*\*\*\*\*\*\*\*\*\*\*\*\*\*\*\*\*\*\*\*\*\*\*\*\*\*\*\*\*\*\*\*\*\*\*\*\*\*\*\*\*\*\*\*\*\*\*\*\*\*\*\*\*\*\*\*\*\*\*\*\*\*\*\*\*\*\*\*\*\*\*\*\*\*\*\*\*\*\*\*\*\*\*\*\*\*\*\*\*\*\*\*\*\*\*\*\*\*\*\*\*\*\*\*\*\*\*\*\*\*\*\*\*\*\*\*\*\*\*\*\*\*\*\*\*\*\*\*\*\*\*\*\*\*\*\*\*\*\*\*\*\*\*\*\*\*\*\*\*\*\*\*\*\*\*\*\*\*\*\*\*\*\*\*\*\*\*\*\*\*\*\*\*\*\*\*\*\*\*\*\*\*\*\*\*\*\*\*\*\*\*\*\*\*\*\*\*\*\*\*\*\*\*\*\*\*\*\*\*\*\*\*\*\*\*\*\*\*\*\*\*\*\*\*\*\*\*\*\*\*\*\*\*\*\*\*\*\u0000.000000000000000000000000000000000000000000000000000000000000000000000000000000000000000000000000000000000000000000000000000000000000000000000000000000000000000000000000000000000000000000000000000000000000000000000000000000000000000000000000000000000000000000000000000000000000000000000000000000000000000000000000000000000000000000000000000000000000000000000000000000000000000000000000000000000000000000000000000000000000000000000000000000000000000000000000000000000000000000000000000000000000000000000000000000000000000000000000000000000000000000000000000000000000000000000000000000000000000000000000000000000000000000000000000000000000000000000000000000000000000000000000000000000000000000000000000000000000000000000000000000000000000000000000000000000000000000000000000000000000000000000000000000000000000000000000000000000000000000000000000000000000000000000000000000000000000000000000000000000000000000000000000000000000000000000000000000000000000000000000000000000000000000000000000000000000000000000000000000000000000000000000000000000000000000000000000000000000000000000000000000000000000000000000000000000000000000000000000000000000000000000000000000000000000000000000000000000000000000000000000000000000000000000000000000000000000000000000000000000000000000000000000000000000000000000000000000000000000000000000000000000000000000000000000000000000000000000000000000000000000000000000000000000000000000000000000000000000000000000000000000000000000000000000000000000000000000000000000000000000000000000000000000000000000000000000000000000000000000000000000000000000000000000000000000000000000000000000000000000000000000000000000000000000000000000000000000000000000000000000000000000000000000000000000000000000000000000000000000000000000000000000000000000000000000000000000000000000000000000000000000000000000000000000000000000000000000000000000000000000000000000000000000000000000000000000000000000000000000000000000000000000000000000000000000000000000000000000000000000000000000000000000000000000000000000000000000000000000000000000000000000000000000000000000000000000000000000000000000000000000000000000000000000000000000000000000000000000000000000000000000000000000000000000000000000000000000000000000000000000000000000000000000000000000000000000000000000000000000000000000000000000000000000000000000000000000000000000000000000000000000000000000000000000000000000000000000000000000000000000000000000000000000000000000000000000000000000000000000000000000000000000000000000000000000000000000000000000000000000000000000000000000000000000000000000000000000000000000000000000000000000000000000000000000000000000000000000000000000000000000000000000000000000000000000000000000000000000000000000000000000000000000000000000000000000000000000000000000000000000000000000000000000000000000000000000000000000000000000000000000000000000000000000000000000000000000000000000000000000000000000000000000000000000000000000000000000000000000000000000000000000000000000000000000000000000000000000000000000000000000000000000000000000000000000000000000000000000000000000000000000000000000000000000000000000000000000000000000000000000000000000000000000000000000000000000000000000000000000000000000000000000000000000000000000000000000000000000000000000000000000000000000000000000000000000000000000000000000000000000000000000000000000000000000000000000000000000000000000000000000000000000000000000000000000000000000000000000000000000000000000000000000000000000000000000000000000000000000000000000000000000000000000000000000000000000000000000000000000000000000000000000000000000000000000000000000000000000000000000000000000000000000000000000000000000000000000000000000000000000000000000000000000000000000000000000000000000000000000000000000000000000000000000000000000000000000000000000000000000000000000000000000000000000000000000000000000000000000000000000000000000000000000000000000000000000000000000000000000000000000000000000000000000000000000000000000000000000000000000000000000000000000000000000000000000000000000000000000000000000000000000000000000000000000000000000000000000000000000000000000000000000000000000000000000000000000000000000000000000000000000000000000000000000000000000000000000000000000000000000000000000000000000000000000000000000000000000000000000000000000000000000000000000000000000000000000000000000000000000000000000000000000000000000000000000000000000000000000000000000000000000000000000000000000000000000000000000000000000000000000000000000000000000000000000000000000000000000000000000000000000000000000000000000000000000000000000000000000000000000000000000000000000000000000000000000000000000000000000000000000000000000000000000000000000000000000000000000000000000000000000000000000000000000000000000000000000000000000000000000000000000000000000000000000000000000000000000000000000000000000000000000000000000000000000000000000000000000000000000000000000000000000000000000000000000000000000000000000000000000000000000000000000000000000000000000000000000000000000000000000000000000000000000000000000000000000000000000000000000000000000000000000000000000000000000000000000000000000000000000000000000000000000000000000000000000000000000000000000000000000000000000000000000000000000000000000000000000000000000000000000000000000000000000000000000000000000000000000000000000000000000000000000000000000
DECODING INTELLIGENCE...
EXPERT: nemotron-free VERSION 1
RUNTIME: free/nvidia/nemotron-nano-12b-v2-vl:free
INTEL_VERIFIED
# Technical Document Extraction: Clinical Note Flowchart
## Overview
The image is a flowchart diagram summarizing a clinical note for a patient with suspected Gastroesophageal Reflux Disease (GERD). The diagram is divided into three main sections: **Clinical Note**, **Rationale**, and **Diagnosis**, with color-coded arrows connecting symptoms, findings, and conclusions.
---
## Clinical Note Section
### Key Labels and Text
- **Chief Complaint**:
- "epigastric and substernal chest pain"
- **Present Illness**:
- "suspected PBC with severe epigastric pain that radiates to her mid-sternal area beginning at ** AM."
- "It did not radiate to her back, and was similar in character to past episodes."
- "She denied water, taking tums, and drinking a lidocaine water mixture."
- "She denied SOB, chest pain, palpitations, nausea, ******."
- "She also denies changes in ****** such as melena or BRBPR."
- "Endoscopy showed hiatal hernia and erosions at the GE junction that were shown to be benign on pathology..."
- **Past Medical History**:
- "..." (No details provided)
- **Pertinent Results**:
- "EGD: Normal mucosa in the esophagus, stomach, and duodenum. ****** polyp in the upper stomach, ****** of the duodenum."
- "EKG: upright axis, sinus rhythm, regular rate at ~60 bpm, intervals wnl, no acute ST changes. ****** reflux monitor: total AET:6.5% on pH-impedance monitoring."
### Highlighted Text (Key Findings)
- **Epigastric and substernal chest pain** (purple highlight)
- **Hiatal hernia and erosions at the GE junction** (orange highlight)
- **Normal mucosa in the esophagus, stomach, and duodenum** (blue highlight)
- **AET greater than 4% on pH-impedance monitoring** (red highlight)
---
## Rationale Section
### Key Labels and Text
- **Common symptoms of GERD**:
- "include chest pain that can be substernal or epigastric."
- **Hiatal hernia and erosions at the gastroesophageal junction**:
- "are common findings in GERD."
- **Absence of erosive damage**:
- "Indicates absence of erosive damage typically seen in severe GERD, but does not rule out GERD as symptoms can occur without visible mucosal damage."
- **AET >4% on pH-impedance monitoring**:
- "supports the diagnosis of GERD."
### Color-Coded Arrows
- **Purple arrows**: Link symptoms (e.g., epigastric/substernal chest pain) to GERD.
- **Orange arrows**: Connect findings (e.g., hiatal hernia, erosions) to GERD.
- **Red arrows**: Highlight diagnostic support (e.g., AET >4%).
---
## Diagnosis Section
### Key Labels and Text
- **Suspected GERD**:
- "Epigastric and substernal chest pain are atypical and typical symptoms of GERD, respectively."
- **Final Diagnosis**:
- "GERD" (confirmed via flowchart connections).
- "AET greater than 4% on pH-impedance monitoring supports the diagnosis of GERD."
---
## Diagram Components and Flow
1. **Clinical Note**:
- Contains patient history, symptoms, and test results.
- Highlighted text emphasizes critical findings (e.g., chest pain, hiatal hernia).
2. **Rationale**:
- Explains how symptoms and findings align with GERD.
- Uses color-coded arrows to map connections:
- Purple: Symptom → GERD
- Orange: Finding → GERD
- Red: Diagnostic support → GERD
3. **Diagnosis**:
- Concludes with "GERD" as the final diagnosis.
- Reinforces AET >4% as a key diagnostic criterion.
---
## Color Legend and Spatial Grounding
- **Legend**: Not explicitly labeled, but colors are used consistently:
- **Purple**: Symptoms (e.g., chest pain).
- **Orange**: Findings (e.g., hiatal hernia).
- **Red**: Diagnostic support (e.g., AET >4%).
- **Spatial Placement**:
- Clinical Note: Left side.
- Rationale: Middle.
- Diagnosis: Right side.
---
## Key Trends and Data Points
- **Symptoms**:
- Epigastric and substernal chest pain (atypical and typical GERD symptoms).
- **Findings**:
- Hiatal hernia and erosions at the GE junction (confirmed via endoscopy).
- **Test Results**:
- Normal mucosa in EGD but presence of a polyp in the upper stomach.
- EKG: Normal sinus rhythm, no acute ST changes.
- AET: 6.5% on pH-impedance monitoring (supports GERD diagnosis).
---
## Conclusion
The flowchart systematically links clinical symptoms, endoscopic findings, and diagnostic test results to confirm GERD. The use of color-coded arrows clarifies the reasoning process, emphasizing that while erosive damage is absent, other criteria (e.g., AET >4%) validate the diagnosis.
DECODING INTELLIGENCE...