\n
## Flowchart: GERD Diagnostic Pathway
### Overview
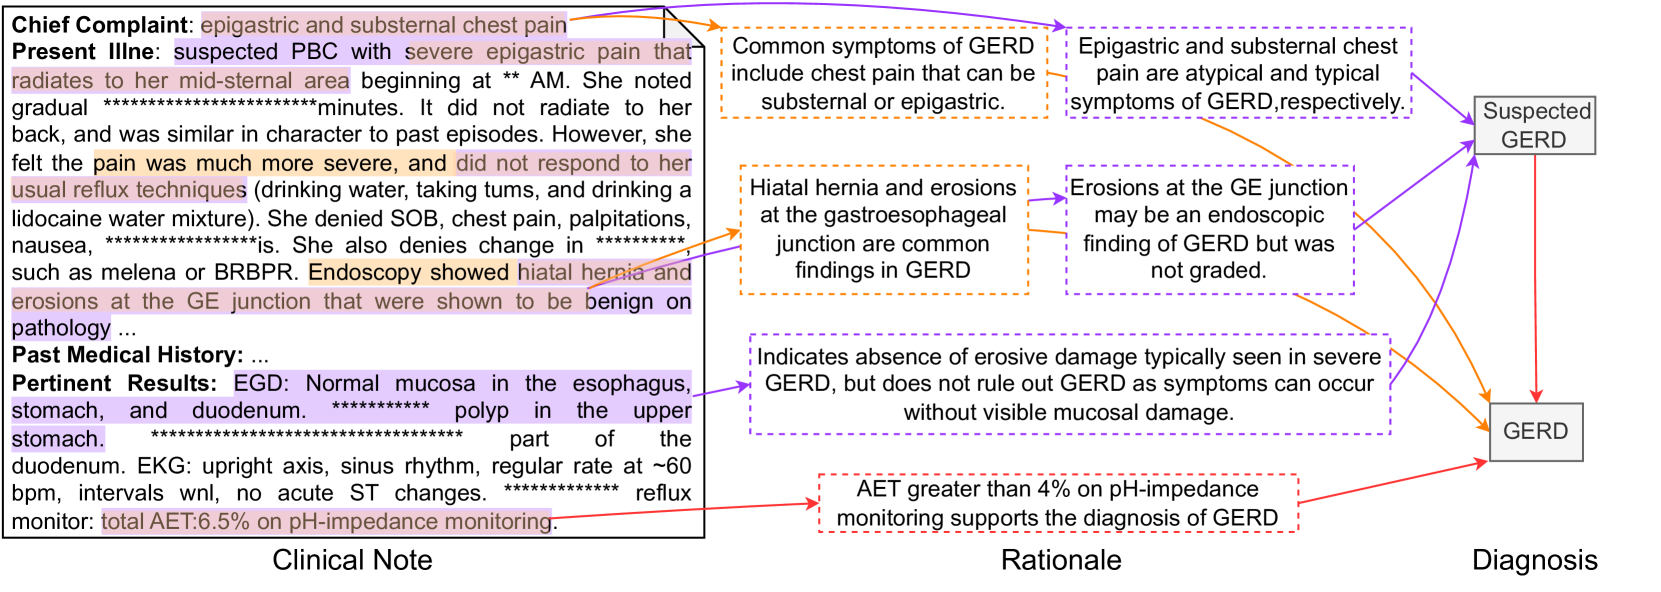
This image presents a flowchart illustrating the diagnostic pathway for suspected Gastroesophageal Reflux Disease (GERD). It links clinical notes, rationale, and diagnosis, outlining the process from initial complaint to final diagnosis. The flowchart uses boxes to represent stages and arrows to indicate the flow of information.
### Components/Axes
The flowchart is divided into three main sections: "Clinical Note" (left), "Rationale" (center), and "Diagnosis" (right). Each section contains text boxes with information. Arrows connect these boxes, indicating the progression of the diagnostic process.
### Detailed Analysis or Content Details
**Clinical Note:**
* **Chief Complaint:** epigastric and substernal chest pain
* **Present Illness:** suspected PBC with severe epigastric pain that radiates to her mid-sternal area beginning at approximately 2 AM. She noted gradual pain over ~minutes. It did not radiate to her back, and was similar in character to past episodes. However, she felt the pain was much more severe, and did not respond to her usual reflux techniques (drinking water, taking turns, and drinking a lidocaine water mixture). She denied SOB, chest pain, palpitations, nausea, and changes in bowel habits such as melena or BRBPR. Endoscopy showed hiatal hernia and erosions at the GE junction that were shown to be benign on pathology.
* **Past Medical History:** ...
* **Pertinent Results:** EGD: Normal mucosa in the esophagus, stomach, and duodenum. Polyp in the upper stomach. Part of the duodenum. EKG: upright axis, sinus rhythm, regular rate at ~60 bpm, intervals w/n, no acute ST changes. Reflux monitor: total AET 6.5% on pH-impedance monitoring.
**Rationale:**
* Common symptoms of GERD include chest pain that can be substernal or epigastric.
* Epigastric and substernal chest pain are atypical and typical symptoms of GERD respectively.
* Hiatal hernia and erosions at the gastroesophageal junction are common findings in GERD.
* Erosions at the GE junction may be an endoscopic finding of GERD but was not graded.
* Indicates absence of erosive damage typically seen in severe GERD, but does not rule out GERD as symptoms can occur without visible mucosal damage.
* AET greater than 4% on pH-impedance monitoring supports the diagnosis of GERD.
**Diagnosis:**
* Suspected GERD (initial stage)
* GERD (final diagnosis)
The arrows indicate the following flow:
1. Clinical Note -> Rationale (Common Symptoms) -> Suspected GERD
2. Clinical Note -> Rationale (Hiatal Hernia/Erosions) -> Suspected GERD
3. Clinical Note -> Rationale (Erosions at GE Junction) -> Suspected GERD
4. Clinical Note -> Rationale (Absence of Erosive Damage) -> Suspected GERD
5. Clinical Note -> Rationale (AET > 4%) -> GERD
### Key Observations
The flowchart highlights that GERD diagnosis isn't solely based on the presence of erosions. Atypical symptoms, hiatal hernia, and pH-impedance monitoring results (AET > 4%) play a crucial role. The progression from "Suspected GERD" to "GERD" is dependent on the rationale provided.
### Interpretation
This flowchart demonstrates a clinical decision-making process for GERD. It emphasizes that GERD can be diagnosed even in the absence of significant erosive damage, relying on a combination of symptom presentation, endoscopic findings (like hiatal hernia), and physiological testing (pH-impedance monitoring). The AET value of 6.5% (from the clinical note) is a key factor supporting the final diagnosis of GERD. The flowchart is a simplified representation of a complex diagnostic process, but it effectively illustrates the key considerations for clinicians. The use of "approximately" (~), and "within" (w/n) indicates uncertainty in the values. The repeated asterisks (********) likely represent redacted patient information.