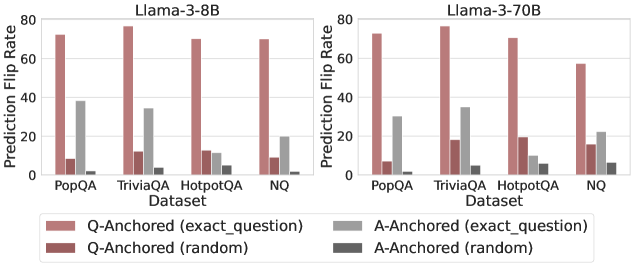
## Bar Chart: Prediction Flip Rate Comparison for Llama-3 Models
### Overview
The image presents two bar charts comparing the prediction flip rates of Llama-3-8B and Llama-3-70B models across different datasets (PopQA, TriviaQA, HotpotQA, and NQ). The charts show the prediction flip rates for question-anchored (Q-Anchored) and answer-anchored (A-Anchored) methods, with both "exact_question" and "random" variations.
### Components/Axes
* **Titles:**
* Left Chart: Llama-3-8B
* Right Chart: Llama-3-70B
* **Y-Axis:** Prediction Flip Rate (ranging from 0 to 80)
* **X-Axis:** Dataset (PopQA, TriviaQA, HotpotQA, NQ)
* **Legend:** Located at the bottom of the image.
* Q-Anchored (exact\_question): Light Brown
* Q-Anchored (random): Dark Brown
* A-Anchored (exact\_question): Light Gray
* A-Anchored (random): Dark Gray
### Detailed Analysis
**Left Chart: Llama-3-8B**
* **PopQA:**
* Q-Anchored (exact\_question): Approximately 73
* Q-Anchored (random): Approximately 8
* A-Anchored (exact\_question): Approximately 38
* A-Anchored (random): Approximately 1
* **TriviaQA:**
* Q-Anchored (exact\_question): Approximately 77
* Q-Anchored (random): Approximately 12
* A-Anchored (exact\_question): Approximately 34
* A-Anchored (random): Approximately 3
* **HotpotQA:**
* Q-Anchored (exact\_question): Approximately 71
* Q-Anchored (random): Approximately 12
* A-Anchored (exact\_question): Approximately 11
* A-Anchored (random): Approximately 5
* **NQ:**
* Q-Anchored (exact\_question): Approximately 70
* Q-Anchored (random): Approximately 12
* A-Anchored (exact\_question): Approximately 20
* A-Anchored (random): Approximately 5
**Right Chart: Llama-3-70B**
* **PopQA:**
* Q-Anchored (exact\_question): Approximately 74
* Q-Anchored (random): Approximately 8
* A-Anchored (exact\_question): Approximately 22
* A-Anchored (random): Approximately 1
* **TriviaQA:**
* Q-Anchored (exact\_question): Approximately 77
* Q-Anchored (random): Approximately 18
* A-Anchored (exact\_question): Approximately 34
* A-Anchored (random): Approximately 2
* **HotpotQA:**
* Q-Anchored (exact\_question): Approximately 74
* Q-Anchored (random): Approximately 10
* A-Anchored (exact\_question): Approximately 10
* A-Anchored (random): Approximately 3
* **NQ:**
* Q-Anchored (exact\_question): Approximately 56
* Q-Anchored (random): Approximately 16
* A-Anchored (exact\_question): Approximately 22
* A-Anchored (random): Approximately 6
### Key Observations
* For both models, the Q-Anchored (exact\_question) method consistently shows the highest prediction flip rates across all datasets.
* The Q-Anchored (random) method generally has low prediction flip rates.
* The A-Anchored (exact\_question) method shows moderate prediction flip rates, while A-Anchored (random) has the lowest.
* The Llama-3-70B model exhibits a slightly lower Q-Anchored (exact\_question) prediction flip rate for the NQ dataset compared to the Llama-3-8B model.
### Interpretation
The data suggests that anchoring the question directly (Q-Anchored, exact\_question) leads to a higher likelihood of prediction flips, indicating potential sensitivity to specific question formulations. Randomizing the question anchoring significantly reduces the flip rate, suggesting that the model relies on specific question structures for its predictions. Answer anchoring shows a lower flip rate compared to question anchoring, implying that the model is more robust to variations in the answer context. The differences between the 8B and 70B models are subtle, but the 70B model shows a slightly reduced flip rate for Q-Anchored (exact\_question) on the NQ dataset, potentially indicating improved robustness.