## Heatmap: Accuracy
### Overview
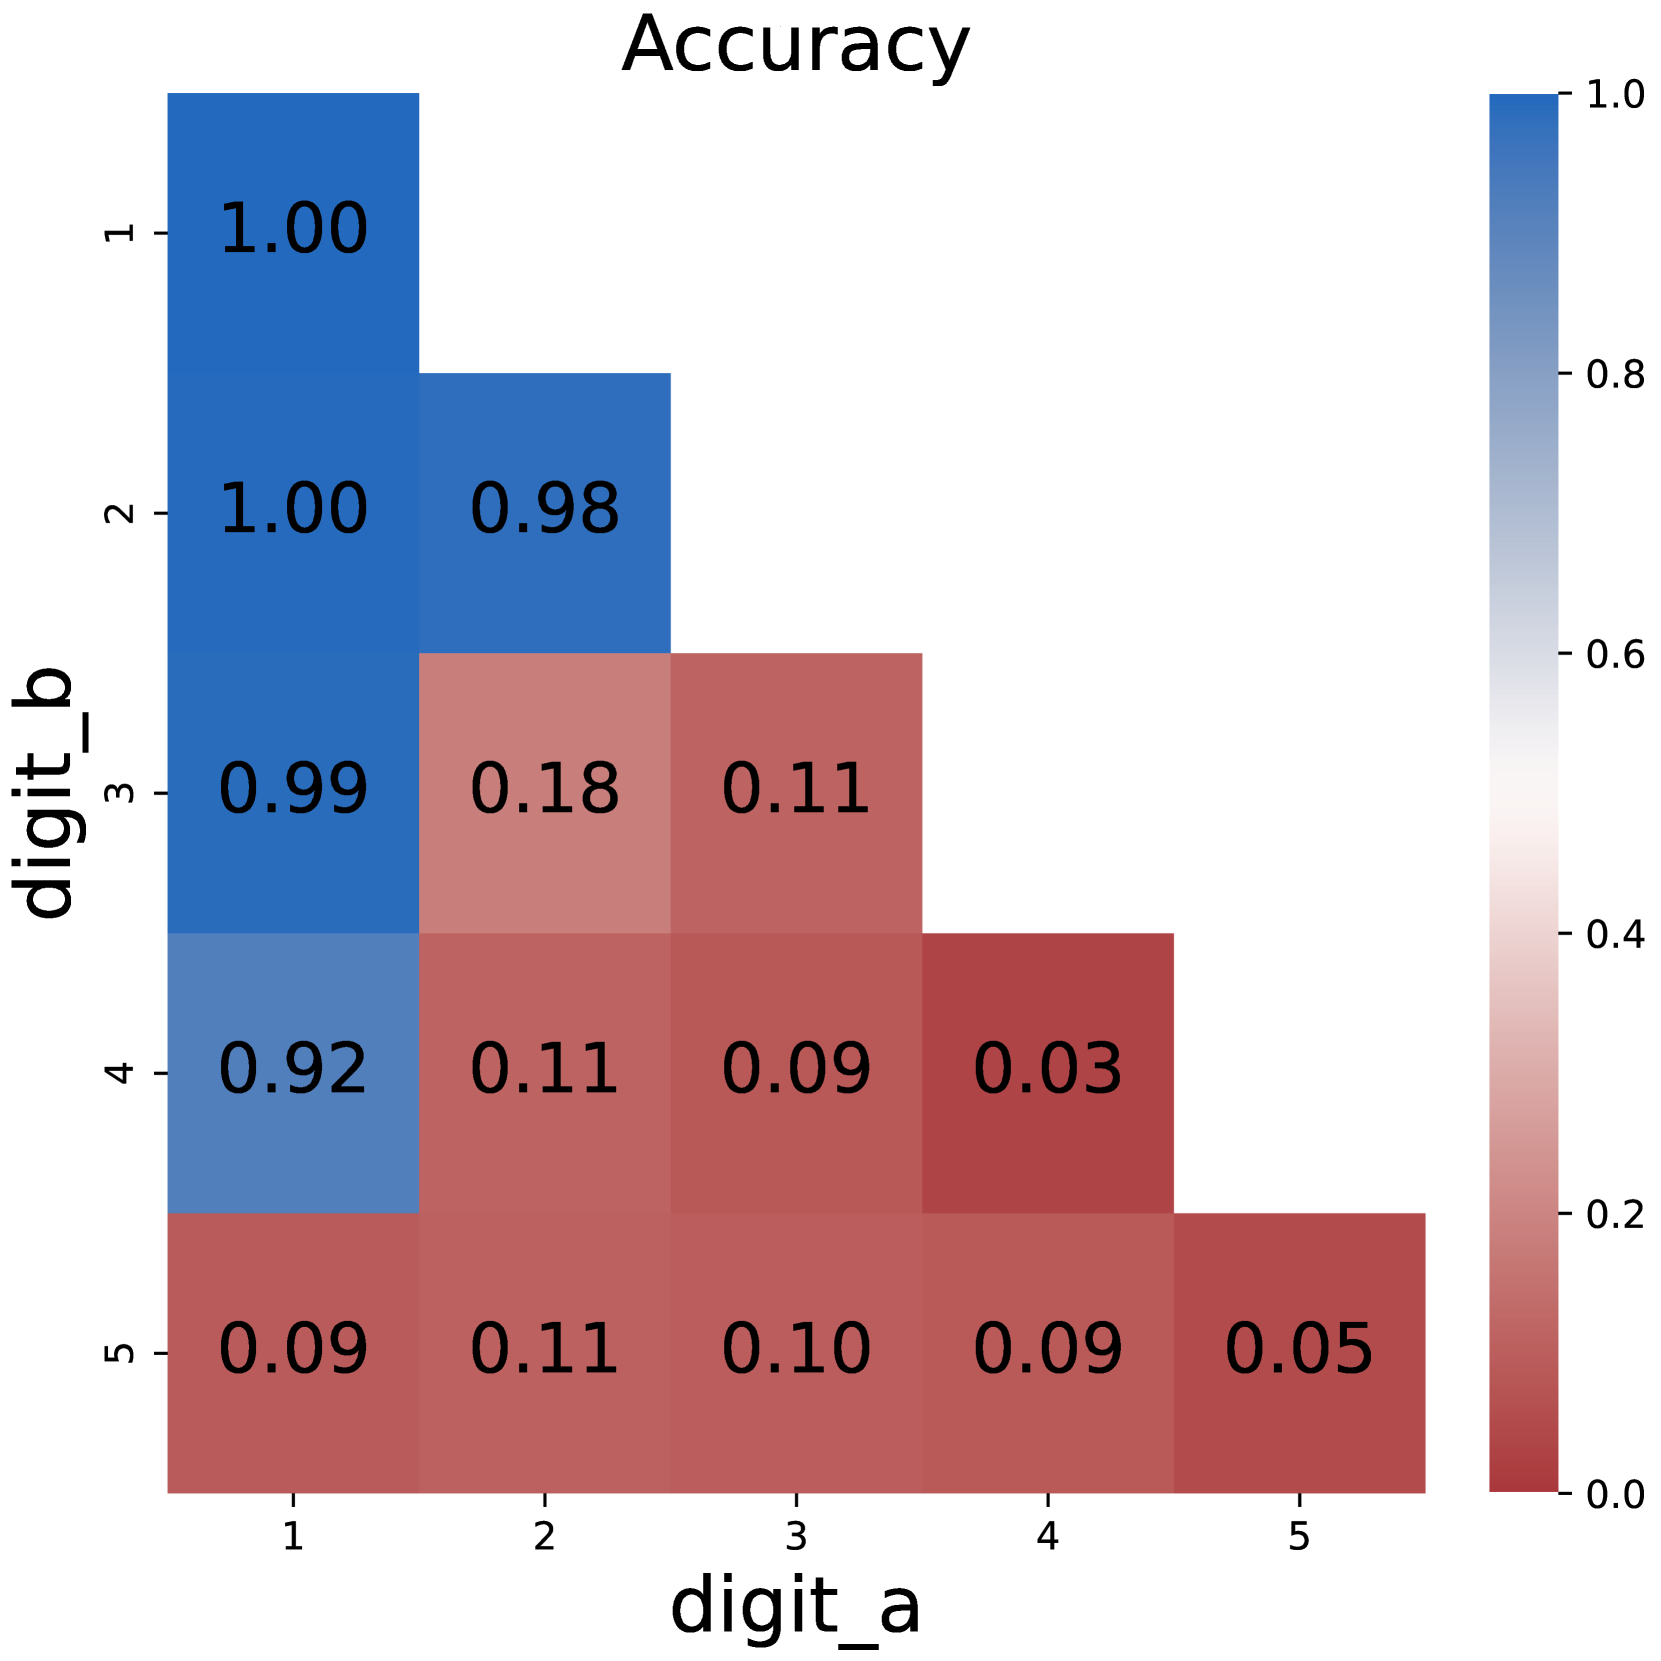
This image presents a heatmap visualizing the accuracy of a digit recognition system, specifically showing how well the system confuses one digit for another. The heatmap displays accuracy values ranging from 0.0 to 1.0, with darker blues representing higher accuracy and darker reds representing lower accuracy. The axes represent the 'true' digit (digit_a) and the 'predicted' digit (digit_b).
### Components/Axes
* **Title:** "Accuracy" - positioned at the top-center of the image.
* **X-axis Label:** "digit\_a" - representing the actual digit. Markers are 1, 2, 3, 4, 5.
* **Y-axis Label:** "digit\_b" - representing the predicted digit. Markers are 1, 2, 3, 4, 5.
* **Colorbar:** Located on the right side of the heatmap. It ranges from 0.0 (dark red) to 1.0 (dark blue), representing the accuracy scale.
* **Data Cells:** Each cell in the grid represents the accuracy of predicting digit 'b' when the actual digit is 'a'. The values are displayed within each cell.
### Detailed Analysis
The heatmap is a 5x5 grid. I will analyze row by row, referencing the colorbar to confirm accuracy.
* **Row 1 (digit\_a = 1):**
* digit\_b = 1: 1.00 (dark blue)
* digit\_b = 2: 1.00 (dark blue)
* digit\_b = 3: 0.99 (light blue)
* digit\_b = 4: 0.92 (medium blue)
* digit\_b = 5: 0.09 (dark red)
* **Row 2 (digit\_a = 2):**
* digit\_b = 1: 1.00 (dark blue)
* digit\_b = 2: 0.98 (light blue)
* digit\_b = 3: 0.18 (red)
* digit\_b = 4: 0.11 (red)
* digit\_b = 5: 0.09 (dark red)
* **Row 3 (digit\_a = 3):**
* digit\_b = 1: 0.99 (light blue)
* digit\_b = 2: 0.18 (red)
* digit\_b = 3: 0.11 (red)
* digit\_b = 4: 0.09 (dark red)
* digit\_b = 5: 0.05 (dark red)
* **Row 4 (digit\_a = 4):**
* digit\_b = 1: 0.92 (medium blue)
* digit\_b = 2: 0.11 (red)
* digit\_b = 3: 0.09 (dark red)
* digit\_b = 4: 0.03 (dark red)
* digit\_b = 5: 0.09 (dark red)
* **Row 5 (digit\_a = 5):**
* digit\_b = 1: 0.09 (dark red)
* digit\_b = 2: 0.11 (red)
* digit\_b = 3: 0.10 (red)
* digit\_b = 4: 0.09 (dark red)
* digit\_b = 5: 0.05 (dark red)
### Key Observations
* The system performs very well at recognizing digits 1 and 2 when they are the actual digits. Accuracy is near 1.0 when predicting 1 or 2 given 1 or 2.
* The system frequently confuses digit 5 for other digits, and vice versa. Accuracy values are consistently low (around 0.05-0.11) when the actual digit is 5.
* Digit 4 is also often misclassified, particularly as other digits.
* The diagonal elements (where predicted = actual) are the highest values, as expected.
* There is a noticeable asymmetry in the confusion matrix. For example, the system is better at predicting '1' when the actual digit is '1' than it is at predicting '1' when the actual digit is '5'.
### Interpretation
This heatmap demonstrates the performance of a digit recognition model. The high accuracy along the diagonal indicates that the model correctly identifies digits most of the time when the input is clear. However, the low accuracy values in several off-diagonal cells reveal specific areas of confusion. The model struggles to differentiate between digits 5 and other digits, suggesting that the features used to recognize '5' are similar to those of other digits, or that the training data for '5' was insufficient or of poor quality. The heatmap provides valuable insights for improving the model, such as focusing on feature engineering or data augmentation for the digits that are frequently misclassified. The pattern of confusion suggests that the model may be sensitive to certain visual characteristics of the digits, leading to systematic errors.