## Line Chart: GSM8K CoT Performance vs. Training Tokens
### Overview
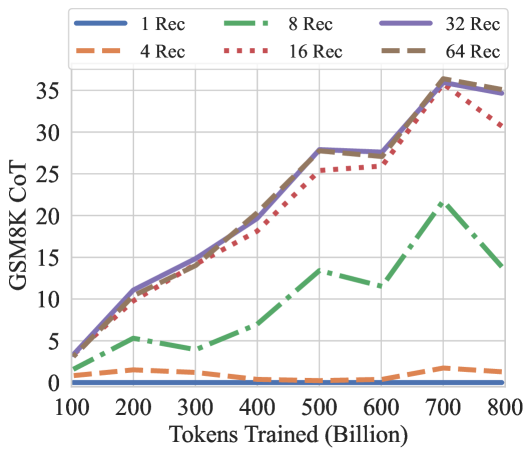
This is a line chart illustrating the performance of different model configurations on the GSM8K Chain-of-Thought (CoT) benchmark as a function of training tokens. The chart compares six configurations, differentiated by the number of "Rec" (likely Recurrence or Recurrent steps), plotted against the total number of tokens trained in billions.
### Components/Axes
* **Chart Type:** Multi-line chart with markers.
* **Y-Axis:** Labeled "GSM8K CoT". The scale runs from 0 to 35, with major gridlines at intervals of 5. This axis represents the performance score (likely accuracy percentage) on the GSM8K CoT benchmark.
* **X-Axis:** Labeled "Tokens Trained (Billion)". The scale runs from 100 to 800, with major tick marks at every 100 billion tokens.
* **Legend:** Positioned at the top center of the chart area. It defines six data series:
* `1 Rec`: Solid blue line.
* `4 Rec`: Dashed orange line.
* `8 Rec`: Dash-dot green line.
* `16 Rec`: Dotted red line.
* `32 Rec`: Solid purple line.
* `64 Rec`: Solid brown line.
* **Grid:** A light gray grid is present for both x and y axes.
### Detailed Analysis
The chart shows the performance trajectory for each "Rec" configuration across increasing training data.
**Trend Verification & Data Points (Approximate):**
1. **1 Rec (Blue, Solid):** This line remains nearly flat at the very bottom of the chart, close to a score of 0 across the entire x-axis range (100B to 800B tokens). It shows no meaningful improvement with more training.
2. **4 Rec (Orange, Dashed):** This line also stays very low, hovering just above 0. It shows a very slight, negligible increase, peaking at approximately 1-2 around 700B tokens before dipping slightly at 800B.
3. **8 Rec (Green, Dash-Dot):** This line shows a moderate, fluctuating upward trend.
* Starts at ~2 at 100B.
* Rises to ~5 at 200B, dips to ~4 at 300B.
* Climbs to ~13 at 500B, dips to ~12 at 600B.
* Peaks at ~21 at 700B.
* Drops significantly to ~14 at 800B.
4. **16 Rec (Red, Dotted):** This line shows a strong, generally upward trend with a notable late drop.
* Starts at ~3 at 100B.
* Rises steadily: ~10 at 200B, ~14 at 300B, ~18 at 400B, ~25 at 500B, ~26 at 600B.
* Peaks at ~34 at 700B.
* Decreases to ~30 at 800B.
5. **32 Rec (Purple, Solid) & 64 Rec (Brown, Solid):** These two lines follow nearly identical, strong upward trajectories, often overlapping. They represent the highest-performing configurations.
* Start at ~4 at 100B.
* Rise sharply: ~11 at 200B, ~15 at 300B, ~21 at 400B, ~28 at 500B, ~27.5 at 600B.
* Both peak at ~36 at 700B.
* Both show a slight decline to ~35 at 800B.
### Key Observations
1. **Performance Hierarchy:** There is a clear and consistent performance hierarchy based on the "Rec" value. Higher "Rec" (32, 64) yields dramatically better results than lower values (1, 4, 8), with 16 Rec occupying a middle-high tier.
2. **Diminishing Returns:** The performance gap between 32 Rec and 64 Rec is negligible, suggesting diminishing returns beyond 32 recurrence steps for this task and training scale.
3. **Critical Threshold:** A significant performance jump occurs between 8 Rec and 16 Rec, and again between 16 Rec and 32 Rec. Configurations with 1 or 4 Rec show almost no capability on this benchmark.
4. **Peak and Decline:** All configurations that show significant learning (8, 16, 32, 64 Rec) peak at 700 billion tokens and then exhibit a performance decline at 800 billion tokens. This drop is most pronounced for 8 Rec and 16 Rec.
5. **Stability:** The 32 Rec and 64 Rec lines are the smoothest, indicating more stable learning progression compared to the more volatile 8 Rec line.
### Interpretation
This chart demonstrates the critical importance of model recurrence (or a similar architectural hyperparameter denoted by "Rec") for solving complex reasoning tasks like grade-school math problems (GSM8K) using chain-of-thought prompting.
* **Architectural Necessity:** The near-zero performance of 1 Rec and 4 Rec models suggests a minimum threshold of recurrence is required for the model to develop any meaningful reasoning capability on this task. The architecture itself, not just data scale, is a fundamental constraint.
* **Scaling Law Interaction:** For capable configurations (≥8 Rec), performance improves reliably with more training data, following a rough power-law trend until a point of saturation or potential overfitting.
* **The 700B Token Peak:** The consistent peak at 700B tokens across multiple series is a striking finding. It may indicate:
* An optimal data-to-parameter ratio for these model sizes.
* The beginning of "overtraining" or degradation on the specific GSM8K evaluation set.
* A characteristic of the training data distribution or curriculum.
* **Practical Implication:** For practitioners, this suggests that investing in higher recurrence (32 Rec) is highly beneficial, but going to 64 Rec may not be cost-effective. Furthermore, training beyond ~700B tokens for this specific setup could be wasteful or even detrimental to benchmark performance. The chart provides a clear visual guide for balancing architectural choices (Rec) with training budget (Tokens).