## Chart: Training Loss Comparison
### Overview
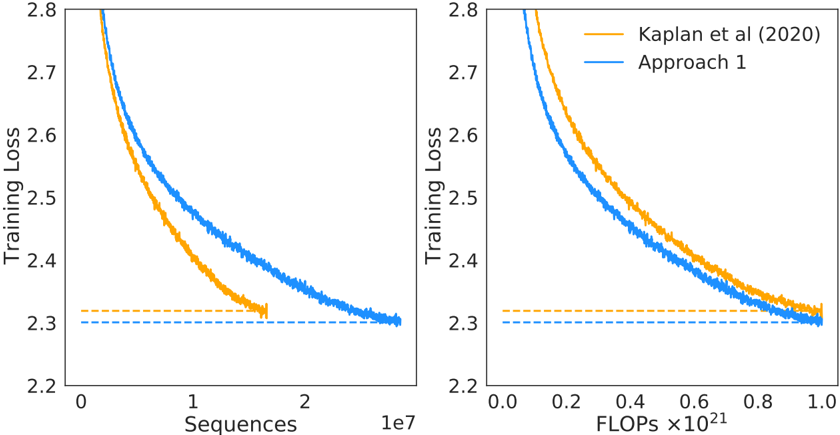
The image presents two line charts comparing the training loss of two approaches, "Kaplan et al (2020)" and "Approach 1," against two different metrics: "Sequences" (left chart) and "FLOPs" (right chart). Both charts show a decreasing trend in training loss as the number of sequences or FLOPs increases.
### Components/Axes
**Left Chart:**
* **Y-axis:** "Training Loss," ranging from 2.2 to 2.8.
* **X-axis:** "Sequences," scaled by 1e7 (10^7), ranging from 0 to 2.
* **Legend:** Located at the top-right of the combined charts.
* Orange line: "Kaplan et al (2020)"
* Blue line: "Approach 1"
* Horizontal dashed lines at y=2.3, one orange and one blue.
**Right Chart:**
* **Y-axis:** "Training Loss," ranging from 2.2 to 2.8.
* **X-axis:** "FLOPs," scaled by 10^21, ranging from 0.0 to 1.0.
* **Legend:** (Same as left chart) Located at the top-right of the combined charts.
* Orange line: "Kaplan et al (2020)"
* Blue line: "Approach 1"
* Horizontal dashed lines at y=2.3, one orange and one blue.
### Detailed Analysis
**Left Chart (Sequences):**
* **Kaplan et al (2020) (Orange):** The training loss starts at approximately 2.8 and decreases rapidly until around 1e7 sequences, then plateaus at approximately 2.3.
* (0, 2.8) -> (1e7, 2.35) -> (2e7, 2.3)
* **Approach 1 (Blue):** The training loss starts at approximately 2.8 and decreases steadily until around 2e7 sequences, reaching approximately 2.3.
* (0, 2.8) -> (1e7, 2.45) -> (2e7, 2.3)
**Right Chart (FLOPs):**
* **Kaplan et al (2020) (Orange):** The training loss starts at approximately 2.8 and decreases rapidly until around 0.6 x 10^21 FLOPs, then plateaus at approximately 2.3.
* (0, 2.8) -> (0.6e21, 2.35) -> (1e21, 2.3)
* **Approach 1 (Blue):** The training loss starts at approximately 2.8 and decreases steadily until around 1.0 x 10^21 FLOPs, reaching approximately 2.3.
* (0, 2.8) -> (0.6e21, 2.4) -> (1e21, 2.3)
### Key Observations
* Both approaches show a decreasing training loss with increasing sequences and FLOPs.
* "Approach 1" consistently has a lower training loss than "Kaplan et al (2020)" for a given number of sequences or FLOPs, until both plateau at approximately 2.3.
* The "Kaplan et al (2020)" approach plateaus earlier (around 1e7 sequences or 0.6 x 10^21 FLOPs) compared to "Approach 1".
* Both approaches converge to a similar training loss value of approximately 2.3.
### Interpretation
The charts suggest that "Approach 1" is more efficient in reducing training loss compared to "Kaplan et al (2020)" for the initial phase of training. "Approach 1" achieves a lower training loss for the same amount of computational effort (FLOPs) or data processed (sequences). However, both approaches eventually converge to a similar minimum training loss. The earlier plateau of "Kaplan et al (2020)" might indicate a faster initial learning rate or a different optimization strategy that leads to quicker initial gains but ultimately limits further improvement. The horizontal dashed lines at y=2.3 likely represent a target or baseline training loss.