## Chart Type: Multiple Line Plots
### Overview
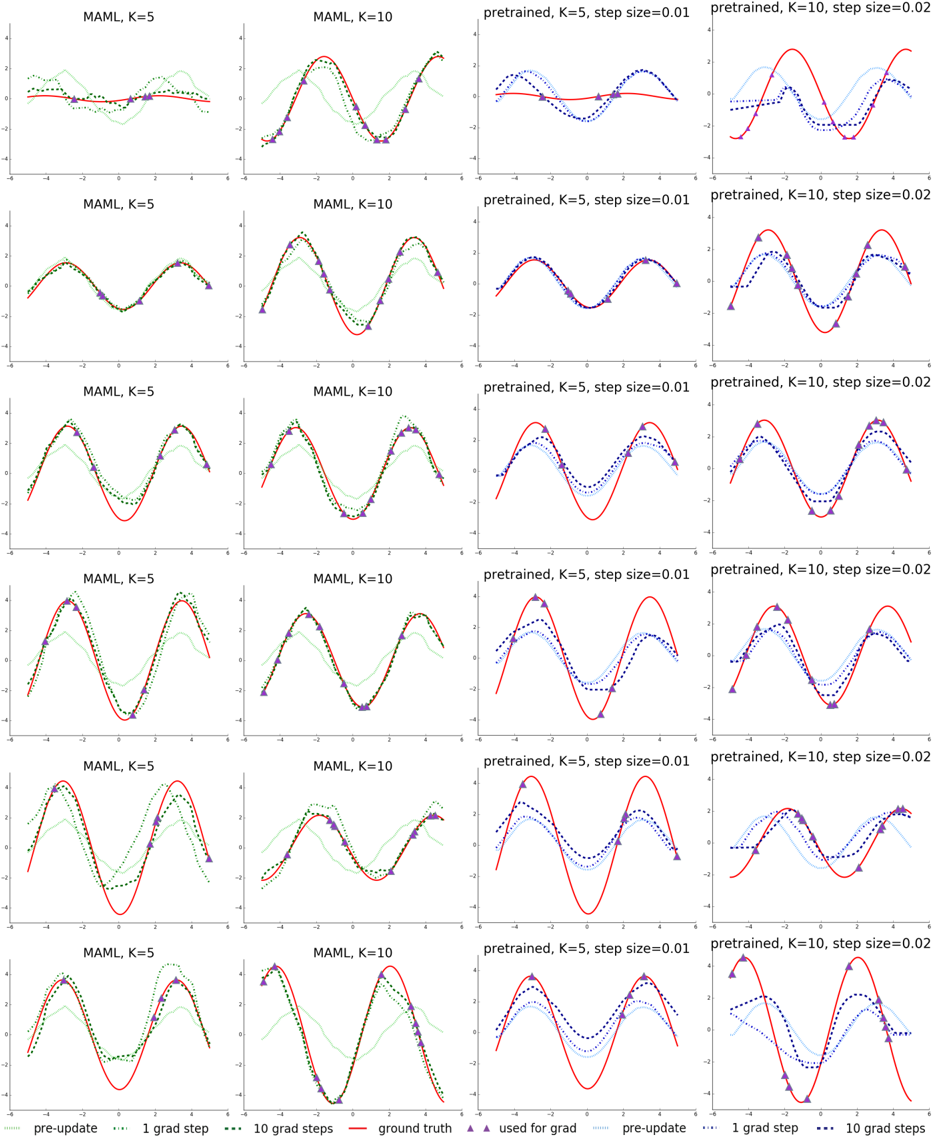
The image presents a grid of line plots comparing the performance of MAML (Model-Agnostic Meta-Learning) and a pretrained model under different conditions. The plots show how the model's prediction evolves with gradient steps, compared to the ground truth. The columns represent different configurations of the models (MAML with K=5, MAML with K=10, pretrained with K=5 and step size 0.01, and pretrained with K=10 and step size 0.02). The rows likely represent different tasks or iterations.
### Components/Axes
* **X-axis:** The x-axis is consistent across all plots, ranging from approximately -6 to 6. It is not explicitly labeled, but it likely represents the input to the function being learned.
* **Y-axis:** The y-axis is consistent across all plots, ranging from approximately -4 to 4. It likely represents the output of the function being learned.
* **Plot Titles:** Each plot has a title indicating the model and its configuration:
* "MAML, K=5"
* "MAML, K=10"
* "pretrained, K=5, step size=0.01"
* "pretrained, K=10, step size=0.02"
* **Legend:** Located at the bottom of the image.
* "pre-update": Light green dotted line
* "1 grad step": Black dotted line
* "10 grad steps": Dark blue dotted line
* "ground truth": Red solid line
* "used for grad": Purple triangle markers
### Detailed Analysis
Each plot contains the following data series:
* **Ground Truth (Red solid line):** Represents the target function that the model is trying to learn. It appears to be a sine wave.
* **Pre-update (Light green dotted line):** Represents the model's prediction before any gradient updates.
* **1 grad step (Black dotted line):** Represents the model's prediction after one gradient update.
* **10 grad steps (Dark blue dotted line):** Represents the model's prediction after ten gradient updates.
* **Used for grad (Purple triangle markers):** Indicates the data points used for gradient calculation.
**Observations for each model type:**
* **MAML (K=5 and K=10):**
* The "pre-update" line (light green) is initially far from the "ground truth" (red).
* After 1 gradient step (black), the prediction moves closer to the ground truth.
* After 10 gradient steps (dark blue), the prediction is generally closer to the ground truth than after 1 step, but there are variations across rows.
* The MAML models seem to adapt reasonably well to the target function, with K=10 generally showing a slightly better fit than K=5.
* **Pretrained (K=5, step size=0.01 and K=10, step size=0.02):**
* The "pre-update" line (light green) starts closer to the ground truth (red) compared to MAML.
* After 1 gradient step (black), the prediction moves closer to the ground truth.
* After 10 gradient steps (dark blue), the prediction can overshoot or oscillate around the ground truth, especially with the larger step size (0.02).
* The pretrained models can converge faster initially, but may be more prone to instability or overfitting with more gradient steps.
**Row-wise observations:**
* The rows show different instances or tasks. The performance of each model varies across these tasks, indicating the adaptability of the models to different target functions.
* In some rows, the "10 grad steps" line closely matches the "ground truth," while in others, it deviates significantly, suggesting that the number of steps needed for convergence depends on the specific task.
### Key Observations
* MAML models start with a random initialization and adapt to the target function through gradient updates.
* Pretrained models start with a better initial guess but can be more sensitive to the step size and may overfit or oscillate.
* The number of gradient steps required for convergence varies depending on the task.
* The purple triangles indicate the data points used for gradient calculation, and their placement influences the model's learning.
### Interpretation
The plots demonstrate the trade-offs between MAML and pretrained models. MAML is more flexible and can adapt to a wider range of tasks, but it requires more gradient steps to converge. Pretrained models can converge faster if the initial pretraining is relevant to the task, but they are more sensitive to the step size and may overfit or oscillate. The choice between MAML and a pretrained model depends on the specific application and the availability of pretraining data. The plots also highlight the importance of selecting an appropriate step size and number of gradient steps for optimal performance.