## Line Chart: CIFAR-100 Test Accuracy vs. Alpha (α)
### Overview
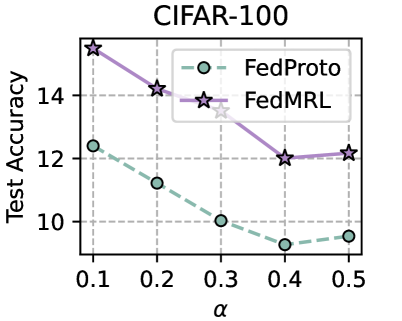
The image is a line chart comparing the test accuracy of two federated learning methods, FedProto and FedMRL, on the CIFAR-100 dataset as a function of the parameter alpha (α). The chart demonstrates that both methods experience a decline in accuracy as α increases, but FedMRL consistently achieves higher accuracy than FedProto across all tested values.
### Components/Axes
* **Title:** "CIFAR-100" (centered at the top).
* **Y-Axis:** Labeled "Test Accuracy". The scale runs from 10 to 14, with major tick marks at 10, 12, and 14. The axis extends slightly below 10 and above 14.
* **X-Axis:** Labeled "α" (the Greek letter alpha). The scale shows discrete values: 0.1, 0.2, 0.3, 0.4, and 0.5.
* **Legend:** Positioned in the top-right quadrant of the chart area.
* **FedProto:** Represented by a green circle (○) connected by a dashed green line.
* **FedMRL:** Represented by a purple star (☆) connected by a solid purple line.
* **Grid:** A light gray, dashed grid is present for both major x and y ticks.
### Detailed Analysis
**Data Series & Trends:**
1. **FedProto (Green Circles, Dashed Line):**
* **Trend:** The line shows a consistent downward slope from left to right, indicating decreasing accuracy with increasing α. The rate of decrease slows slightly between α=0.4 and α=0.5.
* **Data Points (Approximate):**
* α = 0.1: ~12.3
* α = 0.2: ~11.2
* α = 0.3: ~10.0
* α = 0.4: ~9.2
* α = 0.5: ~9.5
2. **FedMRL (Purple Stars, Solid Line):**
* **Trend:** The line also slopes downward overall. It shows a steeper initial decline from α=0.1 to α=0.4, followed by a near-plateau or very slight increase between α=0.4 and α=0.5.
* **Data Points (Approximate):**
* α = 0.1: ~15.5
* α = 0.2: ~14.2
* α = 0.3: ~13.5
* α = 0.4: ~12.1
* α = 0.5: ~12.2
**Spatial & Visual Confirmation:**
* The FedMRL line (purple stars) is positioned vertically above the FedProto line (green circles) at every corresponding α value on the x-axis.
* The gap between the two lines is largest at α=0.1 (~3.2 difference) and narrows as α increases, being smallest at α=0.5 (~2.7 difference).
### Key Observations
1. **Performance Hierarchy:** FedMRL outperforms FedProto at every measured point of α.
2. **Negative Correlation:** For both methods, test accuracy is negatively correlated with the parameter α within the range [0.1, 0.5].
3. **Convergence of Performance:** The performance gap between the two methods decreases as α increases.
4. **Inflection Point:** Both methods show a change in trend slope at α=0.4. FedProto's decline halts and slightly reverses, while FedMRL's decline nearly stops.
### Interpretation
The chart presents a comparative analysis of two algorithms' sensitivity to a hyperparameter (α) on a standard image classification benchmark (CIFAR-100). The data suggests that:
* **Methodological Robustness:** FedMRL is a more robust method than FedProto for this task, as it maintains a higher accuracy under the same conditions (same α value). This could imply better feature representation or more effective model aggregation in the federated learning setting.
* **Hyperparameter Sensitivity:** The parameter α has a significant detrimental effect on the final model performance for both approaches. Without additional context, α could represent a factor like data heterogeneity, client drift, or a regularization term. The negative trend indicates that increasing this factor makes the learning task harder.
* **Diminishing Returns of Mitigation:** The narrowing performance gap suggests that as the problem becomes more challenging (higher α), the relative advantage of the more sophisticated FedMRL method over FedProto diminishes, though it remains superior.
* **Potential Optimal Range:** The data implies that lower values of α (closer to 0.1) are preferable for achieving higher test accuracy with either method. The slight upturn for both at α=0.5 is an interesting anomaly that might warrant further investigation to determine if it's a consistent pattern or noise.