## Diagram: 7x7 Logic Puzzle Grid
### Overview
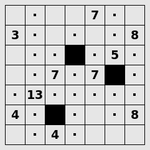
The image displays a 7x7 grid, characteristic of a logic puzzle such as a nonogram or picross. The grid contains a mixture of empty cells (represented by dots `·`), numbered cells, and solid black cells. The numbers serve as clues for solving the puzzle.
### Components/Axes
* **Grid Structure:** A square grid with 7 rows and 7 columns.
* **Cell Types:**
1. **Empty/Unspecified Cells:** Marked with a centered dot (`·`).
2. **Clue Cells:** Contain a single integer (3, 4, 5, 7, 8, 13).
3. **Filled/Black Cells:** Solid black squares.
* **Spatial Layout:** The grid is presented without external labels, axes, or a legend. The internal elements (numbers, dots, black cells) are the sole data.
### Detailed Analysis
The grid contents, transcribed row by row from top to bottom, left to right:
| Row | Col 1 | Col 2 | Col 3 | Col 4 | Col 5 | Col 6 | Col 7 |
| :-- | :---- | :---- | :---- | :---- | :---- | :---- | :---- |
| **1** | · | · | · | · | **7** | · | · |
| **2** | **3** | · | · | · | · | · | **8** |
| **3** | · | · | · | **■** | · | **5** | · |
| **4** | · | · | · | **7** | **7** | **■** | · |
| **5** | · | **13**| · | · | · | · | · |
| **6** | **4** | **■** | · | · | · | · | **8** |
| **7** | · | · | **4** | · | · | · | · |
**Key:**
* `·` = Dot (empty/unspecified cell)
* `■` = Solid black cell
* **Bold numbers** = Clue values within cells.
### Key Observations
1. **Clue Distribution:** Clues are sparse. The highest value, **13**, is located at (Row 5, Column 2). Other clues (3, 4, 5, 7, 8) are scattered.
2. **Black Cell Placement:** Three black cells are present at coordinates (3,4), (4,6), and (6,2). They do not form an immediately obvious pattern.
3. **Number Repetition:** The number **7** appears twice, consecutively in Row 4 (Columns 4 and 5). The number **8** appears twice, in opposite corners (Row 2, Col 7 and Row 6, Col 7). The number **4** appears twice (Row 6, Col 1 and Row 7, Col 3).
4. **Spatial Grouping:** A cluster of clues and a black cell exists in the center-right area (Rows 3-4, Columns 4-6). The leftmost column contains two clues (3 and 4).
### Interpretation
This image is a **puzzle state or setup**, not a data chart. It presents the initial conditions for a deductive logic puzzle.
* **What it represents:** In a nonogram, numbers outside or inside a grid indicate the lengths of consecutive filled (black) cells in that row or column. Here, the numbers are *inside* the grid, which is a common variant. The solver must use these clues to determine which empty cells (`·`) should be filled or left blank to reveal a hidden picture.
* **Relationship between elements:** The numbers are constraints. For example, the **7** in Row 1, Column 5 likely indicates that the 5th row (or column, depending on puzzle rules) contains a run of 7 consecutive filled cells. The existing black cells are fixed parts of the solution. The dots are the unknown variables.
* **Notable anomalies/puzzles:**
* The clue **13** in a 7-cell row/column is impossible if interpreted as a single run. This suggests it might be a sum of multiple runs (e.g., 7+6) or that the puzzle uses a different rule set (e.g., the number indicates the total count of filled cells in that row/column, not run length).
* The placement of black cells seems arbitrary without the solved state, but they serve as critical anchors for deduction.
* The repetition of numbers (7, 8, 4) in different locations provides multiple, separate constraints that must be satisfied simultaneously.
**Conclusion:** The image contains all necessary data to begin solving a specific logic puzzle. To extract further meaning, one would need to apply the puzzle's rules to deduce the complete pattern of filled cells, which is not present in the image itself. The factual content is fully captured in the grid transcription above.