## Scatter Plot: Model Accuracy vs. Data Size on MATH500
### Overview
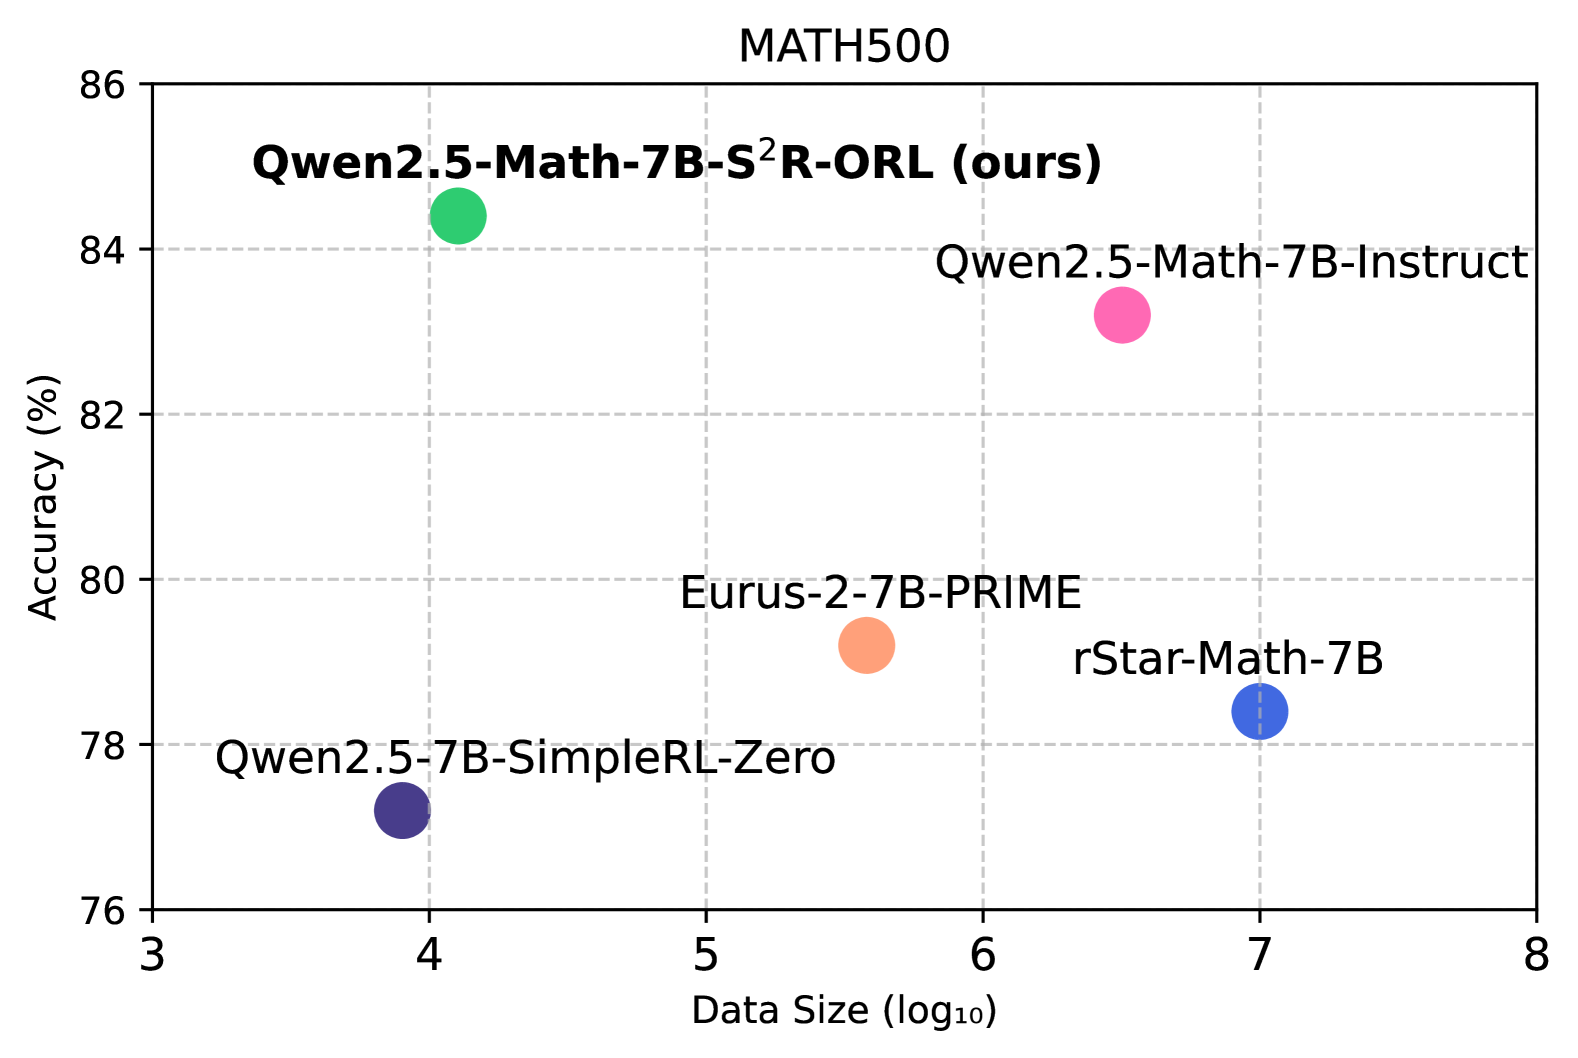
The image is a scatter plot comparing the performance of five different AI models on the "MATH500" benchmark. The chart plots model accuracy against the logarithm (base 10) of the training data size used. Each model is represented by a single, distinctively colored data point with an embedded label.
### Components/Axes
* **Chart Title:** "MATH500" (centered at the top).
* **Y-Axis:** Labeled "Accuracy (%)". The scale runs from 76 to 86, with major tick marks and grid lines at intervals of 2% (76, 78, 80, 82, 84, 86).
* **X-Axis:** Labeled "Data Size (log₁₀)". The scale runs from 3 to 8, with major tick marks and grid lines at integer intervals (3, 4, 5, 6, 7, 8).
* **Data Series & Legend:** There is no separate legend box. Labels are placed directly adjacent to their corresponding data points within the plot area. The five models and their associated colors are:
1. **Qwen2.5-Math-7B-S²R-ORL (ours)** - Green circle.
2. **Qwen2.5-Math-7B-Instruct** - Pink circle.
3. **Eurus-2-7B-PRIME** - Orange circle.
4. **rStar-Math-7B** - Blue circle.
5. **Qwen2.5-7B-SimpleRL-Zero** - Purple circle.
### Detailed Analysis
The plot contains five data points. The following table reconstructs the approximate values based on visual inspection of the chart. All accuracy values are approximate (%).
| Model Name | Color | Approx. Data Size (log₁₀) | Approx. Accuracy (%) | Spatial Position (Relative) |
| :--- | :--- | :--- | :--- | :--- |
| **Qwen2.5-Math-7B-S²R-ORL (ours)** | Green | 4.0 | 84.5 | Top-left quadrant |
| **Qwen2.5-Math-7B-Instruct** | Pink | 6.5 | 83.2 | Top-right quadrant |
| **Eurus-2-7B-PRIME** | Orange | 5.5 | 79.2 | Center |
| **rStar-Math-7B** | Blue | 7.0 | 78.4 | Bottom-right quadrant |
| **Qwen2.5-7B-SimpleRL-Zero** | Purple | 3.9 | 77.2 | Bottom-left quadrant |
**Trend Verification:** There is no single linear trend across all models. The highest accuracy is achieved by the green point ("ours") at a relatively low data size. The pink point ("Instruct") has the second-highest accuracy but uses significantly more data. The blue point ("rStar-Math") uses the most data but has lower accuracy than three other models. The purple point ("SimpleRL-Zero") uses the least data and has the lowest accuracy.
### Key Observations
1. **Efficiency Leader:** The model labeled "(ours)" achieves the highest accuracy (~84.5%) with a comparatively small data size (log₁₀ ≈ 4.0, or ~10,000 samples).
2. **Data vs. Performance:** Increased data size does not guarantee higher accuracy. The model with the largest data size (rStar-Math-7B, log₁₀=7.0 or 10 million samples) performs worse than three models trained on less data.
3. **Clustering:** Two models (Qwen2.5-Math-7B-Instruct and Eurus-2-7B-PRIME) occupy the middle ground in both data size and accuracy.
4. **Baseline Comparison:** The "SimpleRL-Zero" model serves as a low-data, low-accuracy baseline in this comparison.
### Interpretation
This scatter plot is likely from a research paper or technical report introducing the "Qwen2.5-Math-7B-S²R-ORL" model. The primary message is one of **data efficiency and superior performance**. The authors demonstrate that their model ("ours") achieves state-of-the-art accuracy on the MATH500 benchmark while requiring orders of magnitude less training data than competing models like rStar-Math-7B.
The plot challenges the simple assumption that "more data is always better" for this specific task and model scale (7B parameters). It suggests that the training methodology (implied by names like "S²R-ORL", "Instruct", "PRIME", "SimpleRL") is a critical factor, potentially more so than raw data volume. The outlier position of the green point in the top-left quadrant is the key visual argument for the effectiveness of the authors' proposed method.