\n
## Diagram: Quantum State Transitions and Bloch Sphere Representations
### Overview
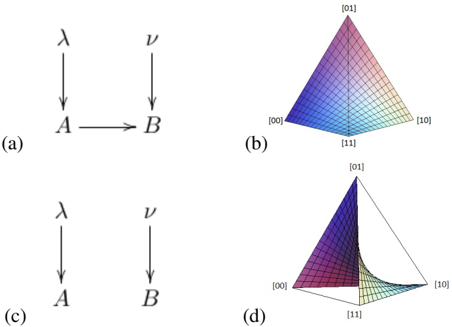
The image presents four diagrams illustrating concepts related to quantum mechanics, specifically focusing on state transitions and their representation on the Bloch sphere. Diagrams (a) and (c) depict state transitions between two levels, labeled A and B, influenced by external factors represented by λ and ν. Diagrams (b) and (d) show 3D representations resembling Bloch spheres, with coordinate labels indicating specific quantum states.
### Components/Axes
* **Diagram (a) & (c):**
* Labels: λ, ν, A, B
* Arrows: Downward arrows labeled λ and ν, and a horizontal arrow from A to B.
* **Diagram (b) & (d):**
* Coordinate Labels: [00], [01], [10], [11] are labeled on the vertices of the triangular shape.
* Surface: A 3D surface with color gradients.
### Detailed Analysis or Content Details
* **Diagram (a):** Shows a transition from state A to state B. A downward arrow labeled "λ" points towards A, and another downward arrow labeled "ν" points towards B. An arrow connects A to B, indicating a transition.
* **Diagram (c):** Similar to (a), shows a transition from state A to state B. A downward arrow labeled "λ" points towards A, and another downward arrow labeled "ν" points towards B. An arrow connects A to B, indicating a transition.
* **Diagram (b):** Displays a triangular surface with coordinate labels at the vertices: [00], [01], [10], and [11]. The surface exhibits a color gradient, transitioning from red to blue. The shape resembles a Bloch sphere representation.
* **Diagram (d):** Similar to (b), displays a triangular surface with coordinate labels at the vertices: [00], [01], [10], and [11]. The surface exhibits a color gradient, transitioning from red to blue. The shape resembles a Bloch sphere representation.
### Key Observations
* Diagrams (a) and (c) are structurally identical, suggesting they represent the same physical process or scenario.
* Diagrams (b) and (d) are also structurally identical, representing the same Bloch sphere configuration.
* The coordinate labels [00], [01], [10], and [11] likely represent the basis states of a two-qubit system.
* The color gradients in (b) and (d) likely represent the probability amplitude or some other quantum property associated with each state.
### Interpretation
The diagrams likely illustrate the effect of external influences (λ and ν) on the transition between two quantum states (A and B). Diagrams (b) and (d) provide a visual representation of the resulting quantum state on the Bloch sphere. The coordinate labels indicate the basis states, and the color gradients represent the probability amplitudes or other quantum properties.
The similarity between (a) and (c), and (b) and (d) suggests that the diagrams are presenting different perspectives of the same underlying quantum phenomenon. The diagrams could be used to explain concepts such as quantum state manipulation, decoherence, or entanglement.
The diagrams do not provide specific numerical data, but rather a qualitative representation of quantum processes. The absence of numerical values limits the extent to which detailed quantitative analysis can be performed. However, the diagrams are valuable for visualizing and understanding the fundamental principles of quantum mechanics.