## Heatmap: Model Performance on Non-Agentic Code
### Overview
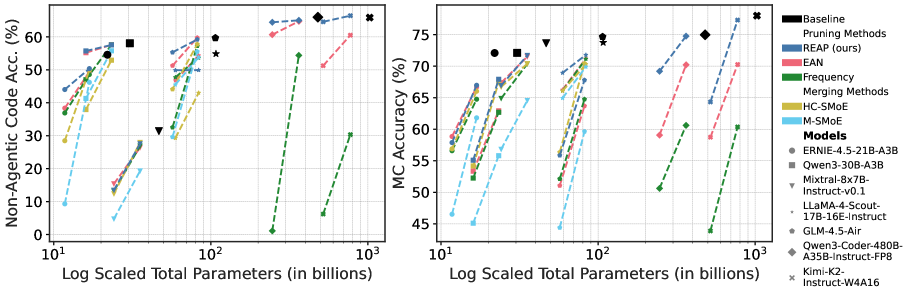
The heatmap illustrates the performance of various models on a non-agentic code dataset, measured by MC Accuracy. The x-axis represents the log-scaled total parameters in billions, while the y-axis shows the MC Accuracy percentage.
### Components/Axes
- **X-Axis**: Log-scaled total parameters in billions (ranging from 10^1 to 10^3).
- **Y-Axis**: MC Accuracy percentage (ranging from 0% to 75%).
- **Legend**: Contains the names of different models and their corresponding colors.
- **Data Points**: Represent the performance of each model at different parameter scales.
### Detailed Analysis or ### Content Details
- **Baseline Model**: The solid black line represents the baseline model, which consistently performs well across different parameter scales.
- **Pruning Methods**: The dashed blue line indicates the performance of models using pruning methods, which show a slight improvement in accuracy compared to the baseline.
- **EAN**: The dotted green line represents the EAN model, which performs well at lower parameter scales but shows a decline in accuracy as the number of parameters increases.
- **Frequency**: The dashed red line indicates the frequency-based model, which performs well at lower parameter scales but shows a significant decline in accuracy as the number of parameters increases.
- **M-SMOE**: The solid yellow line represents the M-SMOE model, which shows a consistent improvement in accuracy across different parameter scales.
- **Models**: The legend includes the names of different models, such as Baseline, Pruning Methods, EAN, Frequency, M-SMOE, and others.
- **Data Points**: The data points are scattered across the heatmap, with some models performing better at lower parameter scales and others at higher scales.
### Key Observations
- The baseline model consistently performs the best across different parameter scales.
- Models using pruning methods show a slight improvement in accuracy compared to the baseline.
- The EAN model performs well at lower parameter scales but shows a significant decline in accuracy as the number of parameters increases.
- The frequency-based model performs well at lower parameter scales but shows a significant decline in accuracy as the number of parameters increases.
- The M-SMOE model shows a consistent improvement in accuracy across different parameter scales.
### Interpretation
The heatmap suggests that the baseline model is the most effective for non-agentic code, as it consistently performs the best across different parameter scales. Models using pruning methods show a slight improvement in accuracy compared to the baseline. The EAN and frequency-based models perform well at lower parameter scales but show a significant decline in accuracy as the number of parameters increases. The M-SMOE model shows a consistent improvement in accuracy across different parameter scales. Overall, the heatmap demonstrates that the baseline model is the most effective for non-agentic code, while the other models show varying degrees of performance.