## Diagram: Data Flow Diagram
### Overview
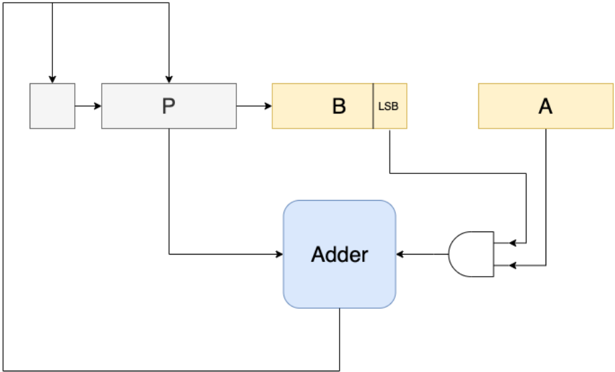
The image is a data flow diagram illustrating a computational process. It shows several components (registers, adder, AND gate) and the flow of data between them.
### Components/Axes
* **Registers:**
* A (yellow)
* B (yellow)
* P (gray)
* Unnamed register (gray)
* **Adder:** (blue)
* **AND Gate:** (white)
* **LSB:** Label indicating the Least Significant Bit of register B.
### Detailed Analysis or ### Content Details
1. **Data Flow:**
* Data flows from the unnamed register to register P.
* Data flows from register P to register B.
* Data flows from the LSB of register B to the AND gate.
* Data flows from register A to the AND gate.
* The output of the AND gate flows to the Adder.
* Data flows from register P to the Adder.
* The output of the Adder flows back to the unnamed register and to register P.
* Data flows from register B to register A.
### Key Observations
* The diagram shows a feedback loop involving the Adder, the unnamed register, and register P.
* The LSB of register B and register A are inputs to an AND gate, whose output is fed into the Adder.
### Interpretation
The diagram represents a computational process, possibly an arithmetic operation or a state machine. The registers A, B, and P likely hold data, while the Adder performs an addition operation. The AND gate seems to control the input to the Adder based on the LSB of register B and the value in register A. The feedback loop suggests an iterative process where the output of the Adder is used in subsequent calculations. The data flow from register B to register A suggests a data transfer or assignment operation.